Matplotlib
Matplotlib 이란 다양한 데이터를 많은 방법으로 도식화 할 수 있도록 하는 파이썬 라이브러리로써, 주로 matplotlib 의 pyplot을 사용한다.Matplotlib 을 사용하게 되면 이전에 사용하였던 numpy 나 pandas 에서 사용되는 자료 구조를 쉽게 시각화 할 수 있다.
Load Package
1
2
import numpy as np
import matplotlib.pyplot as plt
Matplotlib 기본 속성
Matplotlib 에서는 다음과 같은 기본 속성을 가지고 있다.
속성
종류
alpha
투명도
kind
투명도: line, bar, barh, kde
logY
Y축에 대해 Log scaling
use_index
객체의 색인을 눈금 이름으로 사용할 지 여부
rot
눈금 이름 돌리기(rotating)0~360
xticks, yticks
x, y축으로 사용할 값
xlim, ylim
x, y 축의 한계
grid
축의 그리드를 표현할지 여부
subplots
각 column에 독립된 subplot 그리기
sharex, sharey
subplots = True이면 같은 x, y축을 공유하고 눈금과 한계를 연결
figsize
생성될 그래프의 크기를 tuple로 지정
title
그래프의 제목 지정
legend
subplot의 범례 지정
sort_columns
column을 알파벳 순서로 그린다.
점선 그리기
Data 생성
1
2
data = np . random . randn ( 50 ). cumsum ()
data
array([-0.52643756, -0.43216741, -0.64660902,  0.66810856,  1.26133996,
        0.51176633, -2.06579121,  0.13919543,  0.64501733,  0.17811056,
        1.73930986,  3.49944408,  2.49028208,  1.85480593,  2.45579842,
        2.67333743,  2.63689118,  2.89998175,  2.1737935 ,  1.80671599,
        2.69086579,  2.62257335,  1.11423586,  2.19940705,  2.61943852,
        1.72773764,  1.92567366,  2.67938229,  2.58160257,  3.29155193,
        3.90138574,  5.05262044,  4.9761306 ,  5.18704293,  4.32595818,
        4.83653822,  5.78111082,  6.09278176,  7.30988381,  9.0688758 ,
        6.57130842,  5.00812931,  5.02239784,  3.93325657,  2.5465875 ,
        0.86834185,  0.43049766, -0.59775005,  0.47730353, -0.0417067 ])
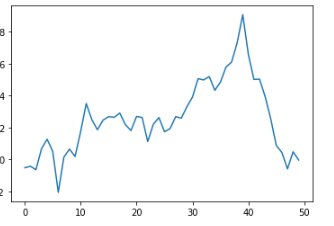
plt.plot(): 그래프 그리기
plt.show(): 그래프 보기
1
2
plt . plot ( data )
plt . show ()
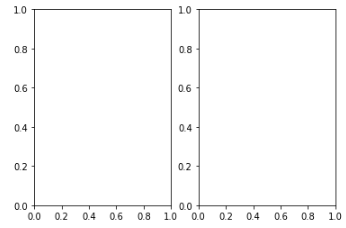
여러 그래프 그리기
plt.subplot(“행”, “열”, “순서”)
1
2
3
plt . subplot ( 1 , 2 , 1 )
plt . subplot ( 1 , 2 , 2 )
plt . show ()
Data 준비하기
1
2
hist_data = np . random . randn ( 100 )
scat_data = np . arange ( 30 )
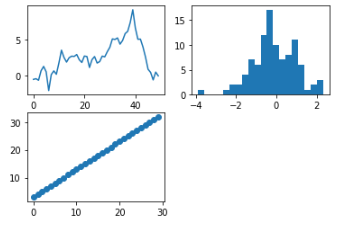
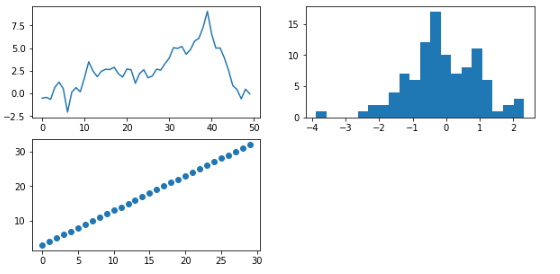
여러 그래프 그리기
1
2
3
4
5
6
7
plt . subplot ( 2 , 2 , 1 )
plt . plot ( data )
plt . subplot ( 2 , 2 , 2 )
plt . hist ( hist_data , bins = 20 )
plt . subplot ( 2 , 2 , 3 )
plt . scatter ( scat_data , np . arange ( 30 ) + 3 )
plt . show ()
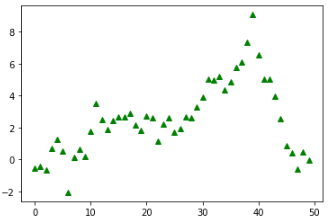
그래프 선 옵션
그래프를 그릴 때 표시되는 색이나 마커 패턴을 바꾸는 것을 확인
색상: b(파란색), g(초록색), r(빨간색), c(청록색), y(노란색), k(검은색), w(흰색)
마커: o(원), v(역삼각형), ^(삼각형), s(네모), +(플러스), .(점)
1
2
plt . plot ( data , 'g^' )
plt . show ()
1
2
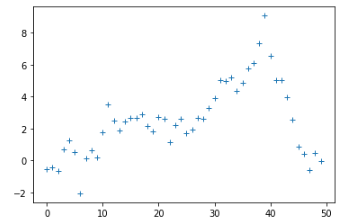
plt . plot ( data , '+' )
plt . show ()
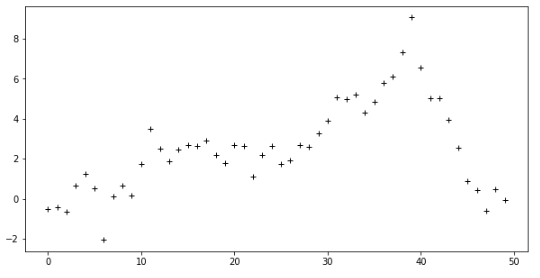
그래프 사이즈 조절
plt.figure 안에 figsize를 이용하여 가로, 세로 길이 조절 가능(inch 단위)
1
2
3
plt . figure ( figsize = ( 10 , 5 ))
plt . plot ( data , 'k+' )
plt . show ()
1
2
3
4
5
6
7
8
plt . figure ( figsize = ( 10 , 5 ))
plt . subplot ( 2 , 2 , 1 )
plt . plot ( data )
plt . subplot ( 2 , 2 , 2 )
plt . hist ( hist_data , bins = 20 )
plt . subplot ( 2 , 2 , 3 )
plt . scatter ( scat_data , np . arange ( 30 ) + 3 )
plt . show ()
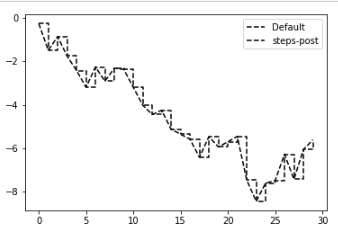
그래프 겹치기 + legend 달기
1
2
3
4
5
6
data = np . random . randn ( 30 ). cumsum ()
plt . plot ( data , 'k--' , label = 'Default' )
plt . plot ( data , 'k--' , drawstyle = 'steps-post' , label = 'steps-post' )
plt . legend ()
plt . show ()
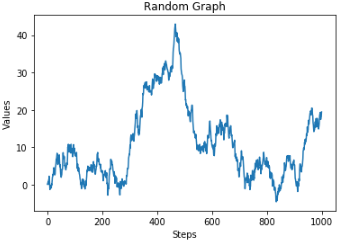
이름 달기
1
2
3
4
5
plt . plot ( np . random . randn ( 1000 ). cumsum ())
plt . title ( 'Random Graph' )
plt . xlabel ( 'Steps' )
plt . ylabel ( 'Values' )
plt . show ()
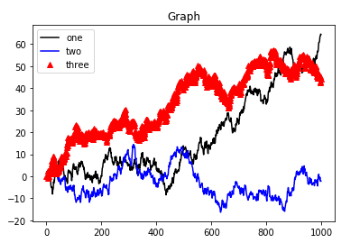
종합
1
2
3
4
5
6
7
plt . title ( 'Graph' )
plt . plot ( np . random . randn ( 1000 ). cumsum (), 'k' , label = 'one' )
plt . plot ( np . random . randn ( 1000 ). cumsum (), 'b-' , label = 'two' )
plt . plot ( np . random . randn ( 1000 ). cumsum (), 'r^' , label = 'three' )
plt . legend ()
plt . show ()
그래프 저장하기
1
plt . savefig ( 'saved_graph.svg' )
<Figure size 432x288 with 0 Axes>
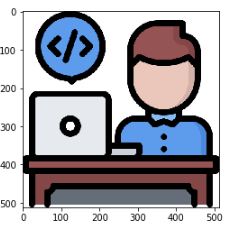
이미지 파일 열기
opencv로도 열 수 있지만, shape 순서가 바뀔 때도 있다.
1
2
3
4
path = './programmer.png'
image_pil = Image . open ( path )
image = np . array ( image_pil )
image . shape
(512, 512, 4)
이미지 정보 확인
image의 크기, 최대, 최소 값을 확인한다.
1
2
image . shape
np . min ( image ), np . max ( image )
(512, 512, 4)
(0, 255)
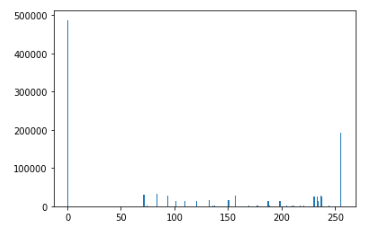
이미지 그래프로 시각화 하기
1
2
plt . hist ( image . ravel (), 256 ,[ 0 , 256 ])
plt . show ()
그림 나타내기
1
2
plt . imshow ( image )
plt . show ()
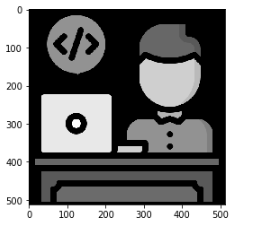
이미지 흑백으로 열기
Image.convert(“L”)을 통하여 회색으로 변환시키는 것이다.
1
2
3
4
image_pil = Image . open ( path ). convert ( "L" )
image_bw = np . array ( image_pil )
plt . imshow ( image_bw , 'gray' )
plt . show ()
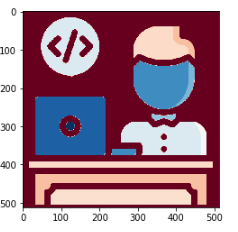
이미지 다른 색상으로 열기
RdBu
1
2
plt . imshow ( image_bw , 'RdBu' )
plt . show ()
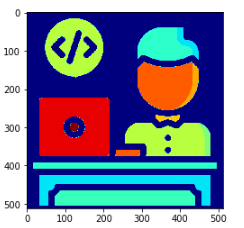
jet
1
2
plt . imshow ( image_bw , 'jet' )
plt . show ()
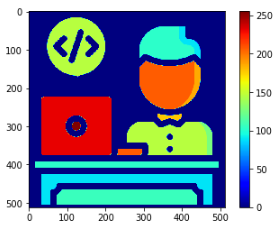
Colorbar 추가하기
1
2
3
plt . imshow ( image_bw , 'jet' )
plt . colorbar ()
plt . show ()
이미지 사이즈 조절
1
2
3
plt . figure ( figsize = ( 10 , 10 ))
plt . imshow ( image )
plt . show ()
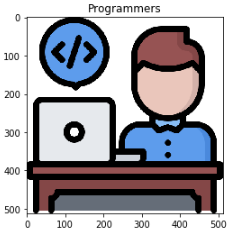
이미지에 제목 추가
1
2
3
plt . title ( 'Programmers' )
plt . imshow ( image )
plt . show ()
두번째 이미지 열기 및 이미지 크기 변환
1
2
3
4
5
6
7
8
9
10
11
path2 = './bomair_logo.png'
image2_pil = Image . open ( path2 )
image2 = np . array ( image2_pil )
plt . imshow ( image2 )
plt . show ()
import cv2
image3 = cv2 . resize ( image2 , ( 512 , 512 ))
image3 . shape , image . shape
((512, 512, 4), (512, 512, 4))
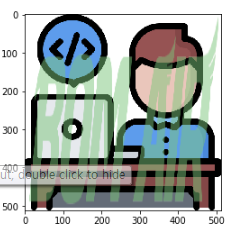
이미지 합치기
1
2
3
plt . imshow ( image )
plt . imshow ( image3 , alpha = 0.5 )
plt . show ()
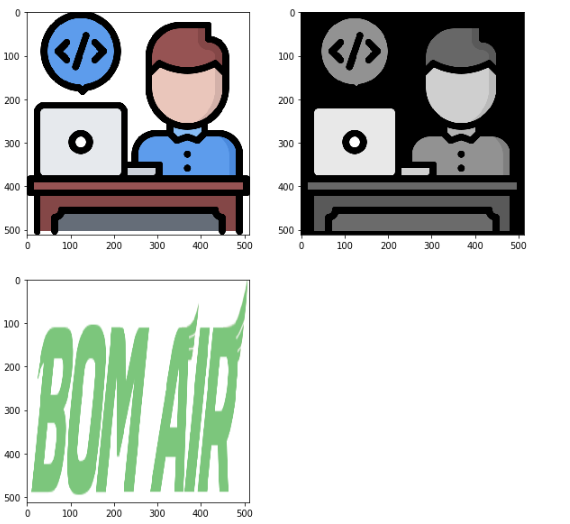
이미지에 Subplot
1
2
3
4
5
6
7
8
9
10
plt . figure ( figsize = ( 10 , 10 ))
plt . subplot ( 2 , 2 , 1 )
plt . imshow ( image )
plt . subplot ( 2 , 2 , 2 )
plt . imshow ( image_bw , 'gray' )
plt . subplot ( 2 , 2 , 3 )
plt . imshow ( image3 )
plt . show ()
참조: 원본코드


Leave a comment