
Django-Project-Result
Web 구현
추가적 대여소의 적절한 위치 제안 이므로 사용자가 위치를 선택했을경우 Trainning 된 Model로 적합도를 평가해준다.
이를 위하여 사용자가 쉽게 접할 수 있는 Web으로서 결과를 구현하고 직접 볼 수 있게 구현하였다.
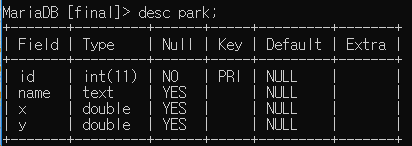
DB
최종적으로 만든 Data들을 분석에 사용하기 위하여 값을 DB에 구성하고 저장하게 되었다.
각각의 독립변수들(Park, People, Pop, River, Road, Univ)은 아래와 같은 형식으로 id, name, x, y 값으로 DB에 저장되었다.
Main 화면
시작하기 위한 Main 화면이다.
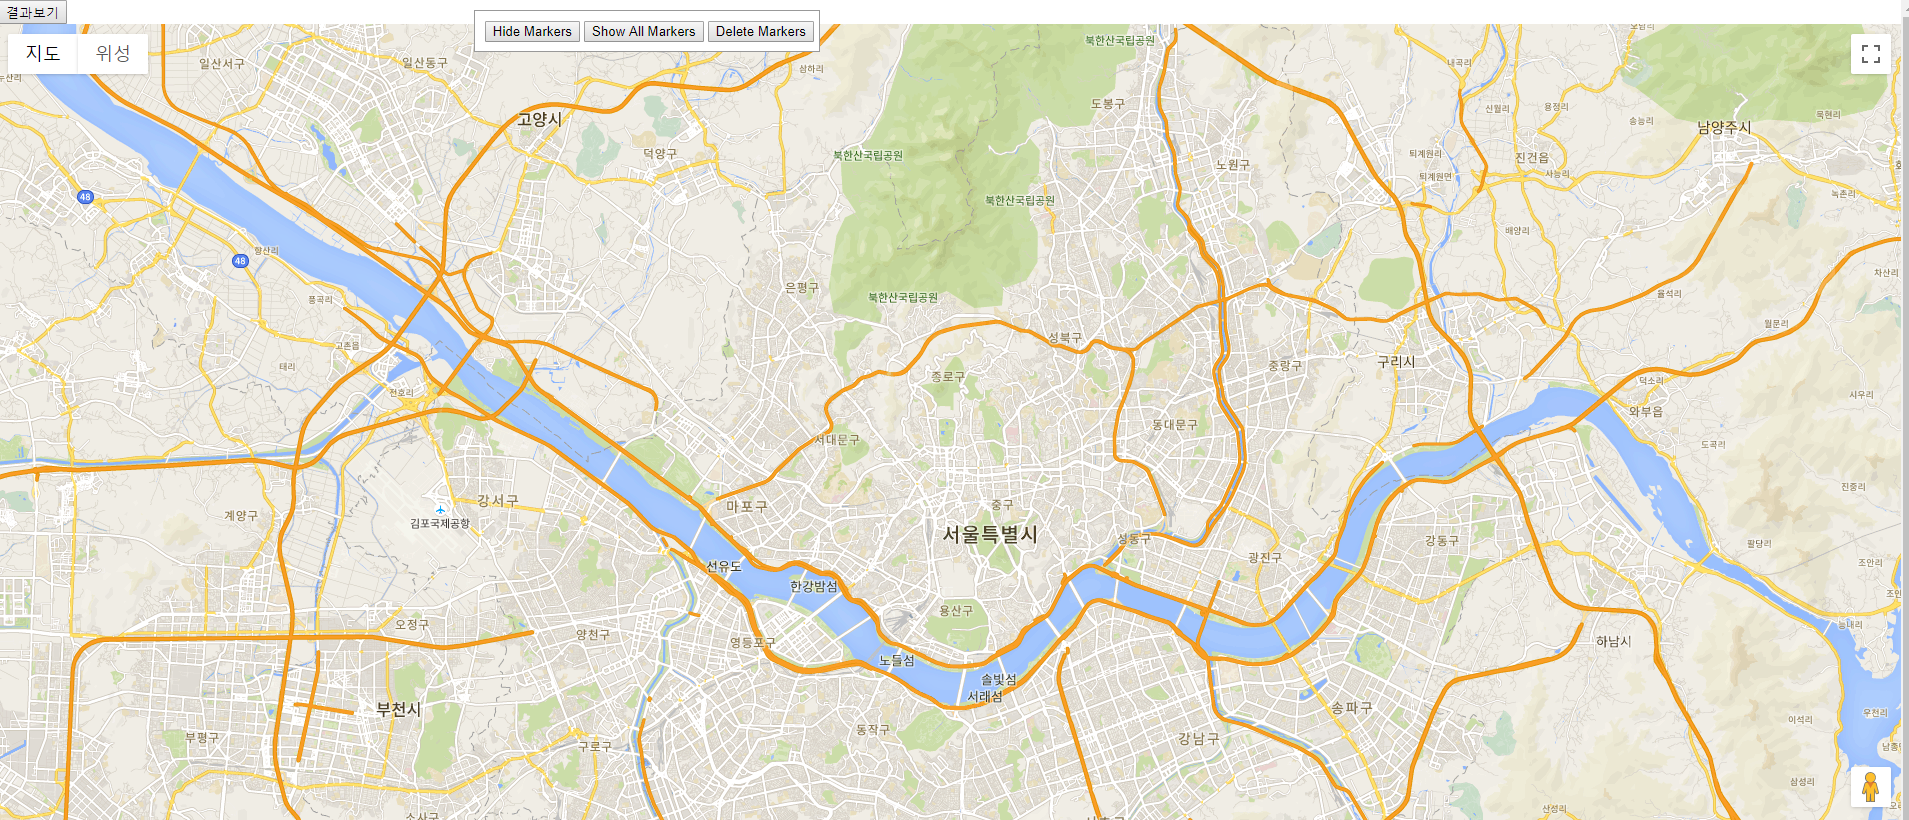
시작하기를 누를경우 사용자가 원하는 위치를 고를 수 있게 지도화면을 보여주게 구현하였다.

원하는 위치 선택
사용자가 원하는 위치를 고를 수 있게 지도화면을 보여주게 구현하였다.
3곳 이상 Click 시 Web상에서 속도를 고려하여 선택 할 수 없게 구현하였다.
지도의 경우 Google API를 사용하였다.
1
2
3
4
5
6
7
8
9
10
11
12
13
14
15
16
17
18
19
20
21
22
23
24
25
26
27
28
29
30
31
32
33
34
35
36
37
38
39
40
41
42
43
44
45
46
47
48
49
50
51
52
53
54
55
56
57
58
59
60
61
62
63
64
65
66
67
68
69
70
71
72
73
74
75
76
77
78
79
80
81
82
83
84
85
86
87
88
89
90
91
92
93
94
95
96
97
98
99
100
101
102
103
104
105
106
107
108
109
110
111
112
113
114
115
116
117
118
119
120
121
122
123
124
125
126
127
128
129
130
131
132
133
134
135
136
137
138
139
140
141
142
143
144
145
146
147
148
149
150
151
152
153
154
155
156
157
158
159
160
161
162
163
164
165
166
167
168
<!DOCTYPE html>
<html>
  <head>
    <title>Removing Markers</title>
    <style>
      /* Always set the map height explicitly to define the size of the div
       * element that contains the map. */
      #map {
        height: 100%;
      }
      /* Optional: Makes the sample page fill the window. */
      html, body {
        height: 100%;
        margin: 0;
        padding: 0;
      }
      #floating-panel {
        position: absolute;
        top: 10px;
        left: 25%;
        z-index: 5;
        background-color: #fff;
        padding: 5px;
        border: 1px solid #999;
        text-align: center;
        font-family: 'Roboto','sans-serif';
        line-height: 30px;
        padding-left: 10px;
      }
    </style>
  </head>
  <body>
    <div id="floating-panel">
      <input onclick="clearMarkers();" type=button value="Hide Markers">
      <input onclick="showMarkers();" type=button value="Show All Markers">
      <input onclick="deleteMarkers();" type=button value="Delete Markers">
    </div>
    <div id="btnArea">
    	<input type="button" name="btnShow" value="결과보기" onClick="result();">

    </div>
    <div id="map"></div>
    <p>Click on the map to add markers.</p>
    <script>
      // In the following example, markers appear when the user clicks on the map.
      // The markers are stored in an array.
      // The user can then click an option to hide, show or delete the markers.
      var map;
      var markers = [];
      var values = [];
      var cnt = 0;

      function initMap() {
        var haightAshbury = {lat: 37.56570028033093, lng: 126.9780855619847};
        map = new google.maps.Map(document.getElementById('map'), {
          zoom: 12,
          center: haightAshbury,
          mapTypeId: 'roadmap'
        });

        // This event listener will call addMarker() when the map is clicked.
        map.addListener('click', function(event) {
          addMarker(event.latLng);
        });

        // Adds a marker at the center of the map.
        //addMarker(haightAshbury);
      }

      // Adds a marker to the map and push to the array.
      function addMarker(location) {

    	  if(cnt >= 3){
          	  alert("마커를 더 이상 찍을 수 없습니다.");
          	  alert(values)
          	  return;
            } else {
    	        markers.push(marker);
    	        cnt++;
    	        if(cnt != 0){
	    	        values.push(location);
	    	        alert(location);
    	        }
    	        if(cnt == 3){
    	        	alert(values)
    	        }
            }

        var marker = new google.maps.Marker({
          position: location,
          map: map
        });

/*         var request = {
        		location: location
              };

              var infowindow = new google.maps.InfoWindow();
              var service = new google.maps.places.PlacesService(map);

              service.getDetails(request, function(place, status) {
                if (status === google.maps.places.PlacesServiceStatus.OK) {
                  var marker = new google.maps.Marker({
                    map: map,
                    position: place.geometry.location
                  });

                  google.maps.event.addListener(marker, 'click', function() {
                    infowindow.setContent('<div>Place ID: ' + location + '</div>');
                    infowindow.open(map, this);
                  });
                }
              }); */

      }

      // Sets the map on all markers in the array.
      function setMapOnAll(map) {
        for (var i = 0; i < markers.length; i++) {
          markers[i].setMap(map);
        }
      }

      // Removes the markers from the map, but keeps them in the array.
      function clearMarkers() {
        setMapOnAll(null);
        cnt=0;
      }

      // Shows any markers currently in the array.
      function showMarkers() {
        setMapOnAll(map);
      }

      // Deletes all markers in the array by removing references to them.
      function deleteMarkers() {
        clearMarkers();
        markers = [];
      }

      function result(){
    	  var count = 0
    	  var form = document.createElement('form');
    	  form.setAttribute('method', 'post');
    	  form.setAttribute('action', '/anal/');
    	  for(var key in values) {
    		  var hiddenField = document.createElement('input');
    		  hiddenField.setAttribute('type', 'hidden');
    		  hiddenField.setAttribute('name', key);
    		  hiddenField.setAttribute('value', values[key]);
    		  form.appendChild(hiddenField);
    		  count = count+1;
    		 }
    	  var hiddenField = document.createElement('input');
		  hiddenField.setAttribute('type', 'hidden');
		  hiddenField.setAttribute('name', 'count');
		  hiddenField.setAttribute('value', count);
		  form.appendChild(hiddenField);

    	  document.body.appendChild(form);
    	  form.submit();
      }

    </script>
    <script async defer src="https://maps.googleapis.com/maps/api/js?key=개인API 키&callback=initMap">
    </script>
  </body>
</html>
결과화면
적합도 평가 Algorithm
- 사용자가 클릭한 곳의 좌표를 가져온 뒤, DB의 값과 Euclidean거리 계산 방식 이용하여 값을 구한다.
- MIN-MAX Normalization을 통하여 각각의 값을 0~1 사이의 값으로 변환한다.
- 2의 과정을 거친 값을 저장해둔 model.pkl을 통하여 따릉이 적합도 상, 중, 하를 판별한다.
- 2~3의 값을 사용자에게 보여주기 위하여 전송한다.
1
2
3
4
5
6
7
8
9
10
11
12
13
14
15
16
17
18
19
20
21
22
23
24
25
26
27
28
29
30
31
32
33
34
35
36
37
38
39
40
41
42
43
44
45
46
47
48
49
50
51
52
53
54
55
56
57
58
59
60
61
62
63
64
65
66
67
68
69
70
71
72
73
74
75
76
77
78
79
80
81
82
83
84
85
86
87
88
89
90
91
92
93
94
95
96
97
98
def AnalFunc(request):
    file_name = os.path.join(os.path.dirname(os.path.dirname(__file__)),'ML/model.pkl')
    model = joblib.load(file_name)

    count = int(request.POST.get('count'))
    data = list()
    for i in range(0,count):
        result=request.POST.get(str(i))
        imsi = repr(result)
        x,y = imsi.split(',')
        data.append([float(y[1:len(y)-2]),float(x[2:len(x)])])


    data_park = pd.DataFrame(list(Park.objects.all().values()))
    data_people = pd.DataFrame(list(People.objects.all().values()))
    data_pop = pd.DataFrame(list(Pop.objects.all().values()))
    data_river = pd.DataFrame(list(River.objects.all().values()))
    data_road = pd.DataFrame(list(Road.objects.all().values()))
    data_univ = pd.DataFrame(list(Univ.objects.all().values()))


    results = []
    for s in range(0,len(data)):
        index=1
        count = 0
        sum = 0
        result = []
        min1 = GeoUtil.get_harversion_distance(data[s][0], data[s][1], data_park["x"][0], data_park["y"][0])
        min2 = GeoUtil.get_harversion_distance(data[s][0], data[s][1], data_pop["x"][0], data_pop["y"][0])
        min3 = GeoUtil.get_harversion_distance(data[s][0], data[s][1], data_river["x"][0], data_river["y"][0])
        min4 = GeoUtil.get_harversion_distance(data[s][0], data[s][1], data_road["x"][0], data_road["y"][0])
        min5 = GeoUtil.get_harversion_distance(data[s][0], data[s][1], data_univ["x"][0], data_univ["y"][0])

        for a in range(0, len(data_park)):
            d1 = GeoUtil.get_harversion_distance(data[s][0], data[s][1], data_park["x"][a], data_park["y"][a])
            if d1 < min1:
                min1 = d1

        for a in range(0, len(data_pop)):
            d2 = GeoUtil.get_harversion_distance(data[s][0], data[s][1], data_pop["x"][a], data_pop["y"][a])
            if d2 < min2:
                min2 = d2

        for a in range(0, len(data_river)):
            d3 = GeoUtil.get_harversion_distance(data[s][0], data[s][1], data_river["x"][a], data_river["y"][a])
            if d3 < min3:
                min3 = d3

        for a in range(0, len(data_road)):
            d4 = GeoUtil.get_harversion_distance(data[s][0], data[s][1], data_road["x"][a], data_road["y"][a])
            if d4 < min4:
                min4 = d4

        for a in range(0, len(data_univ)):
            d5 = GeoUtil.get_harversion_distance(data[s][0], data[s][1], data_univ["x"][a], data_univ["y"][a])
            if d5 < min5:
                min5 = d5

        for a in range(0, len(data_people)):
            d6 = GeoUtil.get_harversion_distance(data[s][0], data[s][1], data_people["x"][a], data_people["y"][a])
            if d6 < 1.5:
                sum += data_people["count"][a]
                count += 1

        if(count ==0):
            sum = 1
            count=1

        people = sum/count
        result1 = (people-0)/(412554-0)
        result2 = (min1-0.03253)/(14.97119-0.03253)
        result3 = (min2-0.06655)/(16.08754-0.06655)
        result4 = (min4-0.04874)/(10.9346-0.04874)
        result5 = (min3-0.03363)/(8.05676-0.03363)
        result6 = (min5-0.14916)/(11.71905-0.14916)

        #people, park, population, road, river, univ, 1~3(1: 최상, 2:중간, 3: 최악)
        Data = pd.DataFrame(data=[[result1,result2,result3,result4,result5,result6]])
        result7 = model.predict(Data)[0]
        result1 = round(result1 *100)
        result2 = 100-round(result2 *100)
        result3 = 100-round(result3 *100)
        result4 = 100-round(result4 *100)
        result5 = 100-round(result5 *100)
        result6 = 100-round(result6 *100)
        if(result7==1):
            result7 = '상'
        elif(result7==2):
            result7='중'
        else:
            result7='하'

        results.append({"result1":result1,"result2":result2,"result3":result3,"result4":result4,"result5":result5,"result6":result6,"result7":result7,"x":data[s][0],"y":data[s][1],"index":index})
        index = index+1
        print(index)
    print(results)
    return render(request, 'charts.html',{"result":results})
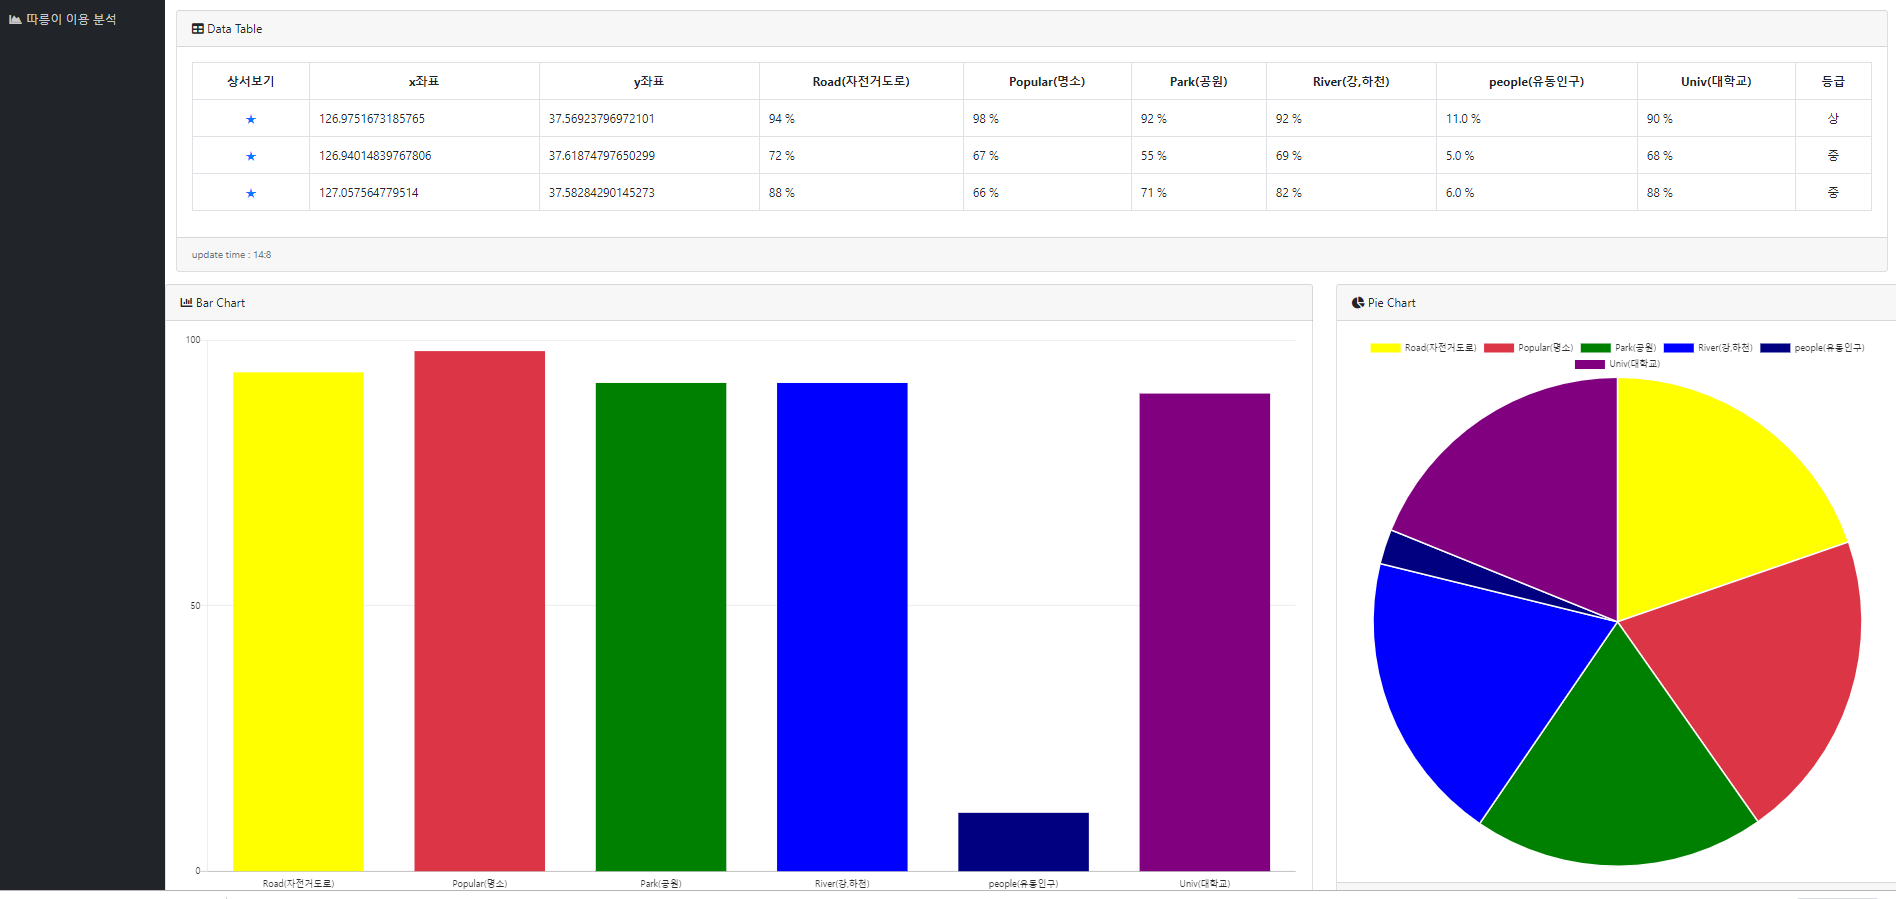
결과화면
Google의 Bar Chart와 Pie Chart를 그려주는 JS를 통하여 분석결과를 사용자에게 상세히 보여주는 과정이다.
Bar Chart & Pie Chart
1
2
3
4
5
6
7
8
9
10
11
12
13
14
15
16
17
18
19
20
21
22
23
24
25
26
27
28
29
30
31
32
33
34
35
36
37
38
39
40
41
42
43
44
45
46
47
48
49
50
51
52
53
54
55
56
57
58
59
60
61
62
63
64
65
66
67
68
69
  <script>
function func(var1,var2,var3,var4,var5,var6){

  //Set new default font family and font color to mimic Bootstrap's default styling
  Chart.defaults.global.defaultFontFamily = '-apple-system,system-ui,BlinkMacSystemFont,"Segoe UI",Roboto,"Helvetica Neue",Arial,sans-serif';
  Chart.defaults.global.defaultFontColor = '#292b2c';

  // Bar Chart Example
  var ctx = document.getElementById("myBarChart");
  var myLineChart = new Chart(ctx, {
    type: 'bar',
    data: {
      labels: ["Road(자전거도로)", "Popular(명소)", "Park(공원)", "River(강,하천)", "people(유동인구)", "Univ(대학교)"],
      datasets: [{
        label: "Revenue",
        backgroundColor: ['yellow', '#dc3545', 'green', 'blue', 'navy', 'purple'],
        borderColor: "rgba(2,117,216,1)",
        data: [var1,var2,var3,var4,var5,var6],
      }],
    },
    options: {
      scales: {
        xAxes: [{
          time: {
            unit: 'month'
          },
          gridLines: {
            display: false
          },
          ticks: {
            maxTicksLimit: 6
          }
        }],
        yAxes: [{
          ticks: {
            min: 0,
            max: 100,
            maxTicksLimit: 5
          },
          gridLines: {
            display: true
          }
        }],
      },
      legend: {
        display: false
      }
    }
  });

//Set new default font family and font color to mimic Bootstrap's default styling
  Chart.defaults.global.defaultFontFamily = '-apple-system,system-ui,BlinkMacSystemFont,"Segoe UI",Roboto,"Helvetica Neue",Arial,sans-serif';
  Chart.defaults.global.defaultFontColor = '#292b2c';

  // Pie Chart Example
  var ctx = document.getElementById("myPieChart");
  var myPieChart = new Chart(ctx, {
    type: 'pie',
    data: {
      labels: ["Road(자전거도로)", "Popular(명소)", "Park(공원)", "River(강,하천)", "people(유동인구)", "Univ(대학교)"],
      datasets: [{
        data: [var1,var2,var3,var4,var5,var6],
        backgroundColor: ['yellow', '#dc3545', 'green', 'blue', 'navy', 'purple'],
      }],
    },
  });
}

  </script>
결과
시연영상
참조:원본코드
코드에 문제가 있거나 궁금한 점이 있으면 wjddyd66@naver.com으로 Mail을 남겨주세요.
Leave a comment