R-Shiny
Shiny
shiny는 R로 웹 어플리케이션을 만들 수 있게 해주는 프레임 워크이다. => Spring, Django같이 웹 어플리케이션을 만들 수 있게 해주는 프레임 워크, Html, Css, JS 다 적용 가능
참조: 천프로 블로그
1
2
3
4
5
6
7
8
9
10
11
12
13
14
15
16
17
18
19
20
21
22
23
24
25
26
27
28
29
30
31
32
33
34
35
36
37
38
39
40
41
42
43
44
45
46
47
48
#
# This is a Shiny web application. You can run the application by clicking
# the 'Run App' button above.
#
# Find out more about building applications with Shiny here:
#
#    http://shiny.rstudio.com/
#

library(shiny)

# Define UI for application that draws a histogram
#브라우저로 출력 담당
ui <- fluidPage(
    #텍스트 입력
    textInput('myText','Input test'),
    verbatimTextOutput('txt1'),

    br(),br(),
    sliderInput('num','Number Increment',10,min=1,max=10),
    verbatimTextOutput('txt2'),

    selectInput('sel','Select',choices = c('Choice'='1','2','3')),
    verbatimTextOutput('txt3'),

    actionButton("action",label = "Button"),
    verbatimTextOutput('txt4'),

    radioButtons("radio",label=h3("Radio Button")
                 ,choices=list("choice1"=1,"choice2"=2),
                 selected=1),
    verbatimTextOutput('txt5')

)

# Define server logic required to draw a histogram
#처리 담당 = Logic
server <- function(input, output) {
    output$txt1<-renderText({input$myText})
    output$txt2<-renderText({input$num})
    output$txt3<-renderText({input$sel})
    output$txt4<-renderPrint({input$action})

}

# Run the application
shinyApp(ui = ui, server = server)
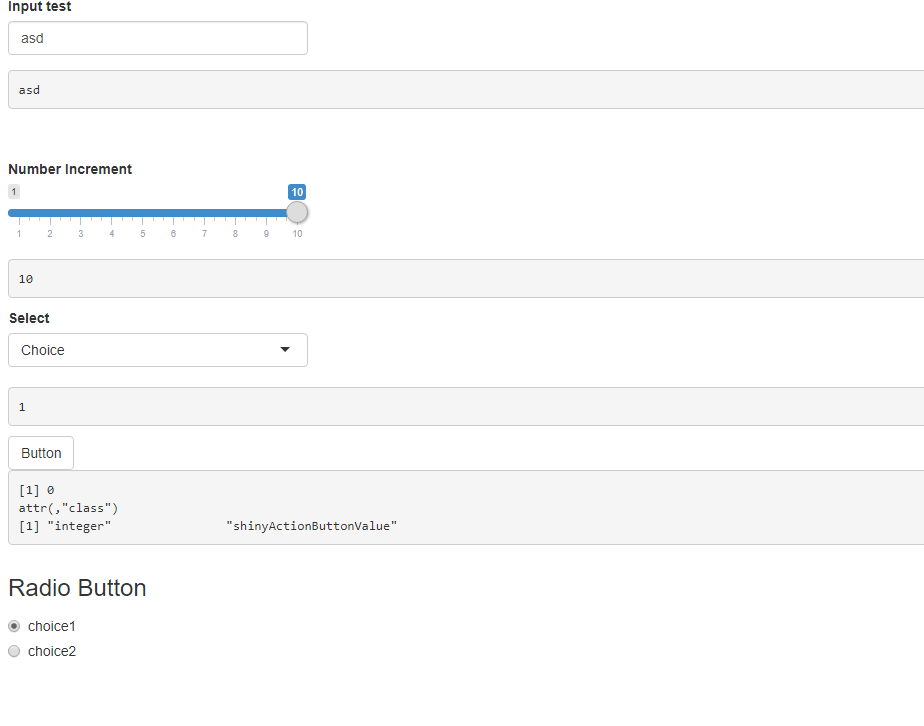
결과:

참조: 원본코드
코드에 문제가 있거나 궁금한 점이 있으면 wjddyd66@naver.com으로 Mail을 남겨주세요.

Leave a comment