Ch2.End to End Machine Learning Project
End to End Machine Learning Project
하나의 Machine Learning Project를 진행한다고 하였을 때 대략적인 Workflow를 알아보는 Post이다.
Setup
실제 Project를 진행하기 앞서 사용하고자 하는 Library확인 및 원하는 Version(Python 언어 특성상 Version에 많이 의존하게 된다.)이 설치되어있는지 확인하는 작업이다.
또한, 자주 사용하게 될 Function이나, Directory를 지정하기도 한다.
1
2
3
4
5
6
7
8
9
10
11
12
13
14
15
16
17
18
19
20
21
22
23
24
25
26
27
28
29
30
31
32
33
34
35
36
37
38
39
40
41
# Python ≥3.5 is required
import sys
assert sys.version_info >= (3, 5)

# Scikit-Learn ≥0.20 is required
import sklearn
assert sklearn.__version__ >= "0.20"

# Common imports
import numpy as np
import pandas as pd
import os
import tarfile
import urllib

# To plot pretty figures
%matplotlib inline
import matplotlib as mpl
import matplotlib.pyplot as plt
import matplotlib.image as mpimg
mpl.rc('axes', labelsize=14)
mpl.rc('xtick', labelsize=12)
mpl.rc('ytick', labelsize=12)

# Where to save the figures
PROJECT_ROOT_DIR = "."
CHAPTER_ID = "end_to_end_project"
IMAGES_PATH = os.path.join(PROJECT_ROOT_DIR, "images", CHAPTER_ID)
os.makedirs(IMAGES_PATH, exist_ok=True)

def save_fig(fig_id, tight_layout=True, fig_extension="png", resolution=300):
    path = os.path.join(IMAGES_PATH, fig_id + "." + fig_extension)
    print("Saving figure", fig_id)
    if tight_layout:
        plt.tight_layout()
    plt.savefig(path, format=fig_extension, dpi=resolution)


# Split the Dataset
from sklearn.model_selection import train_test_split
from sklearn.model_selection import StratifiedShuffleSplit
Get the data
실제로 Model을 만들기 전에 Model의 Training 및 Validation, Prediction을 확인하기 위하여 Dataset을 준비하는 단계이다.
실제로 계획한 Model을 위해서 가장 우선시 해야 하는 작업이고, 원하는 Model에 적합한 Dataset이 존재하지 않는다면, 새롭게 만들거나 Model의 설계를 바꿔야 한다.
즉, Machine Learning은 Dataset에 의존을 많이 한다.
1
2
3
4
5
6
7
8
9
10
11
12
13
14
15
16
17
18
19
20
21
22
23
# Dataset URL & Define Directory
DOWNLOAD_ROOT = "https://raw.githubusercontent.com/ageron/handson-ml2/master/"
HOUSING_PATH = os.path.join("datasets", "housing")
HOUSING_URL = DOWNLOAD_ROOT + "datasets/housing/housing.tgz"

# Get .tgz -> .csv
def fetch_housing_data(housing_url=HOUSING_URL, housing_path=HOUSING_PATH):
    if not os.path.isdir(housing_path):
        os.makedirs(housing_path)
    tgz_path = os.path.join(housing_path, "housing.tgz")
    urllib.request.urlretrieve(housing_url, tgz_path)
    housing_tgz = tarfile.open(tgz_path)
    housing_tgz.extractall(path=housing_path)
    housing_tgz.close()

# Get CSV Data
def load_housing_data(housing_path=HOUSING_PATH):
    csv_path = os.path.join(housing_path, "housing.csv")
    return pd.read_csv(csv_path)

# Get the data
fetch_housing_data()
housing = load_housing_data()
Pandas를 살펴보게 되면 기본적인 Pandas를 다루는 법에 대해서 나와있다.
.head()로서 Data의 처음 5행을 확인한다.
.info()로서 Data의 Column의 특성에 대하여 확인한다.
.values_counts()로서 Vlaues의 Count를 확인한다. 이러한 작업은 Numeric한 Data(Category, etc…)가 아닌 경우 사용한다.
.describe()로서 Dataformat의 대략적인 특징을 확인한다.
- count: 개수
- mean: 평균
- std: 표준편차
- min: 최소값
- 25%: 사분위중 1분위수
- 50%: 사분위중 2분위수
- 75%: 사분위중 3분위수
- max: 최대값
아래 결과를 확인하면 전체적인 Data의 개수는 20640이지만, total_bedrooms의 경우 20433개의 Sample을 가지고 있기 때문에 Data Preprocessing을 거쳐야 하는 것을 알 수 있다. 또한, ocean_proximity는 Object로 되어있어 Category Value인 것을 확인할 수 있다. One-Hot-Encoding이나 다른 값으로서 치환하는 Preprocessing작업이 필요한 것을 알 수 있다.
1
2
3
4
5
6
7
8
9
10
11
print('Housing Data Head')
print(housing.head())

print('\n Housing Data Info')
print(housing.info())

print("\n Housing Data('ocean_proximity') value_counts")
print(housing["ocean_proximity"].value_counts())

print('\n Housing Data Describe')
print(housing.describe())
1
2
3
4
5
6
7
8
9
10
11
12
13
14
15
16
17
18
19
20
21
22
23
24
25
26
27
28
29
30
31
32
33
34
35
36
37
38
39
40
41
42
43
44
45
46
47
48
49
50
51
52
53
54
55
56
57
58
59
60
61
62
63
64
65
66
67
68
69
70
71
Housing Data Head
   longitude  latitude  housing_median_age  total_rooms  total_bedrooms  \
0    -122.23     37.88                41.0        880.0           129.0
1    -122.22     37.86                21.0       7099.0          1106.0
2    -122.24     37.85                52.0       1467.0           190.0
3    -122.25     37.85                52.0       1274.0           235.0
4    -122.25     37.85                52.0       1627.0           280.0

   population  households  median_income  median_house_value ocean_proximity
0       322.0       126.0         8.3252            452600.0        NEAR BAY
1      2401.0      1138.0         8.3014            358500.0        NEAR BAY
2       496.0       177.0         7.2574            352100.0        NEAR BAY
3       558.0       219.0         5.6431            341300.0        NEAR BAY
4       565.0       259.0         3.8462            342200.0        NEAR BAY

 Housing Data Info
<class 'pandas.core.frame.DataFrame'>
RangeIndex: 20640 entries, 0 to 20639
Data columns (total 10 columns):
longitude             20640 non-null float64
latitude              20640 non-null float64
housing_median_age    20640 non-null float64
total_rooms           20640 non-null float64
total_bedrooms        20433 non-null float64
population            20640 non-null float64
households            20640 non-null float64
median_income         20640 non-null float64
median_house_value    20640 non-null float64
ocean_proximity       20640 non-null object
dtypes: float64(9), object(1)
memory usage: 1.6+ MB
None

 Housing Data('ocean_proximity') value_counts
<1H OCEAN     9136
INLAND        6551
NEAR OCEAN    2658
NEAR BAY      2290
ISLAND           5
Name: ocean_proximity, dtype: int64

 Housing Data Describe
          longitude      latitude  housing_median_age   total_rooms  \
count  20640.000000  20640.000000        20640.000000  20640.000000
mean    -119.569704     35.631861           28.639486   2635.763081
std        2.003532      2.135952           12.585558   2181.615252
min     -124.350000     32.540000            1.000000      2.000000
25%     -121.800000     33.930000           18.000000   1447.750000
50%     -118.490000     34.260000           29.000000   2127.000000
75%     -118.010000     37.710000           37.000000   3148.000000
max     -114.310000     41.950000           52.000000  39320.000000

       total_bedrooms    population    households  median_income  \
count    20433.000000  20640.000000  20640.000000   20640.000000
mean       537.870553   1425.476744    499.539680       3.870671
std        421.385070   1132.462122    382.329753       1.899822
min          1.000000      3.000000      1.000000       0.499900
25%        296.000000    787.000000    280.000000       2.563400
50%        435.000000   1166.000000    409.000000       3.534800
75%        647.000000   1725.000000    605.000000       4.743250
max       6445.000000  35682.000000   6082.000000      15.000100

       median_house_value
count        20640.000000
mean        206855.816909
std         115395.615874
min          14999.000000
25%         119600.000000
50%         179700.000000
75%         264725.000000
max         500001.000000
matplotlib을 활용하여 각각의 Column에 대하여 Visualization하면 다음과 같다.
1
2
3
housing.hist(bins=50, figsize=(25,20))
save_fig("attribute_histogram_plots")
plt.show()
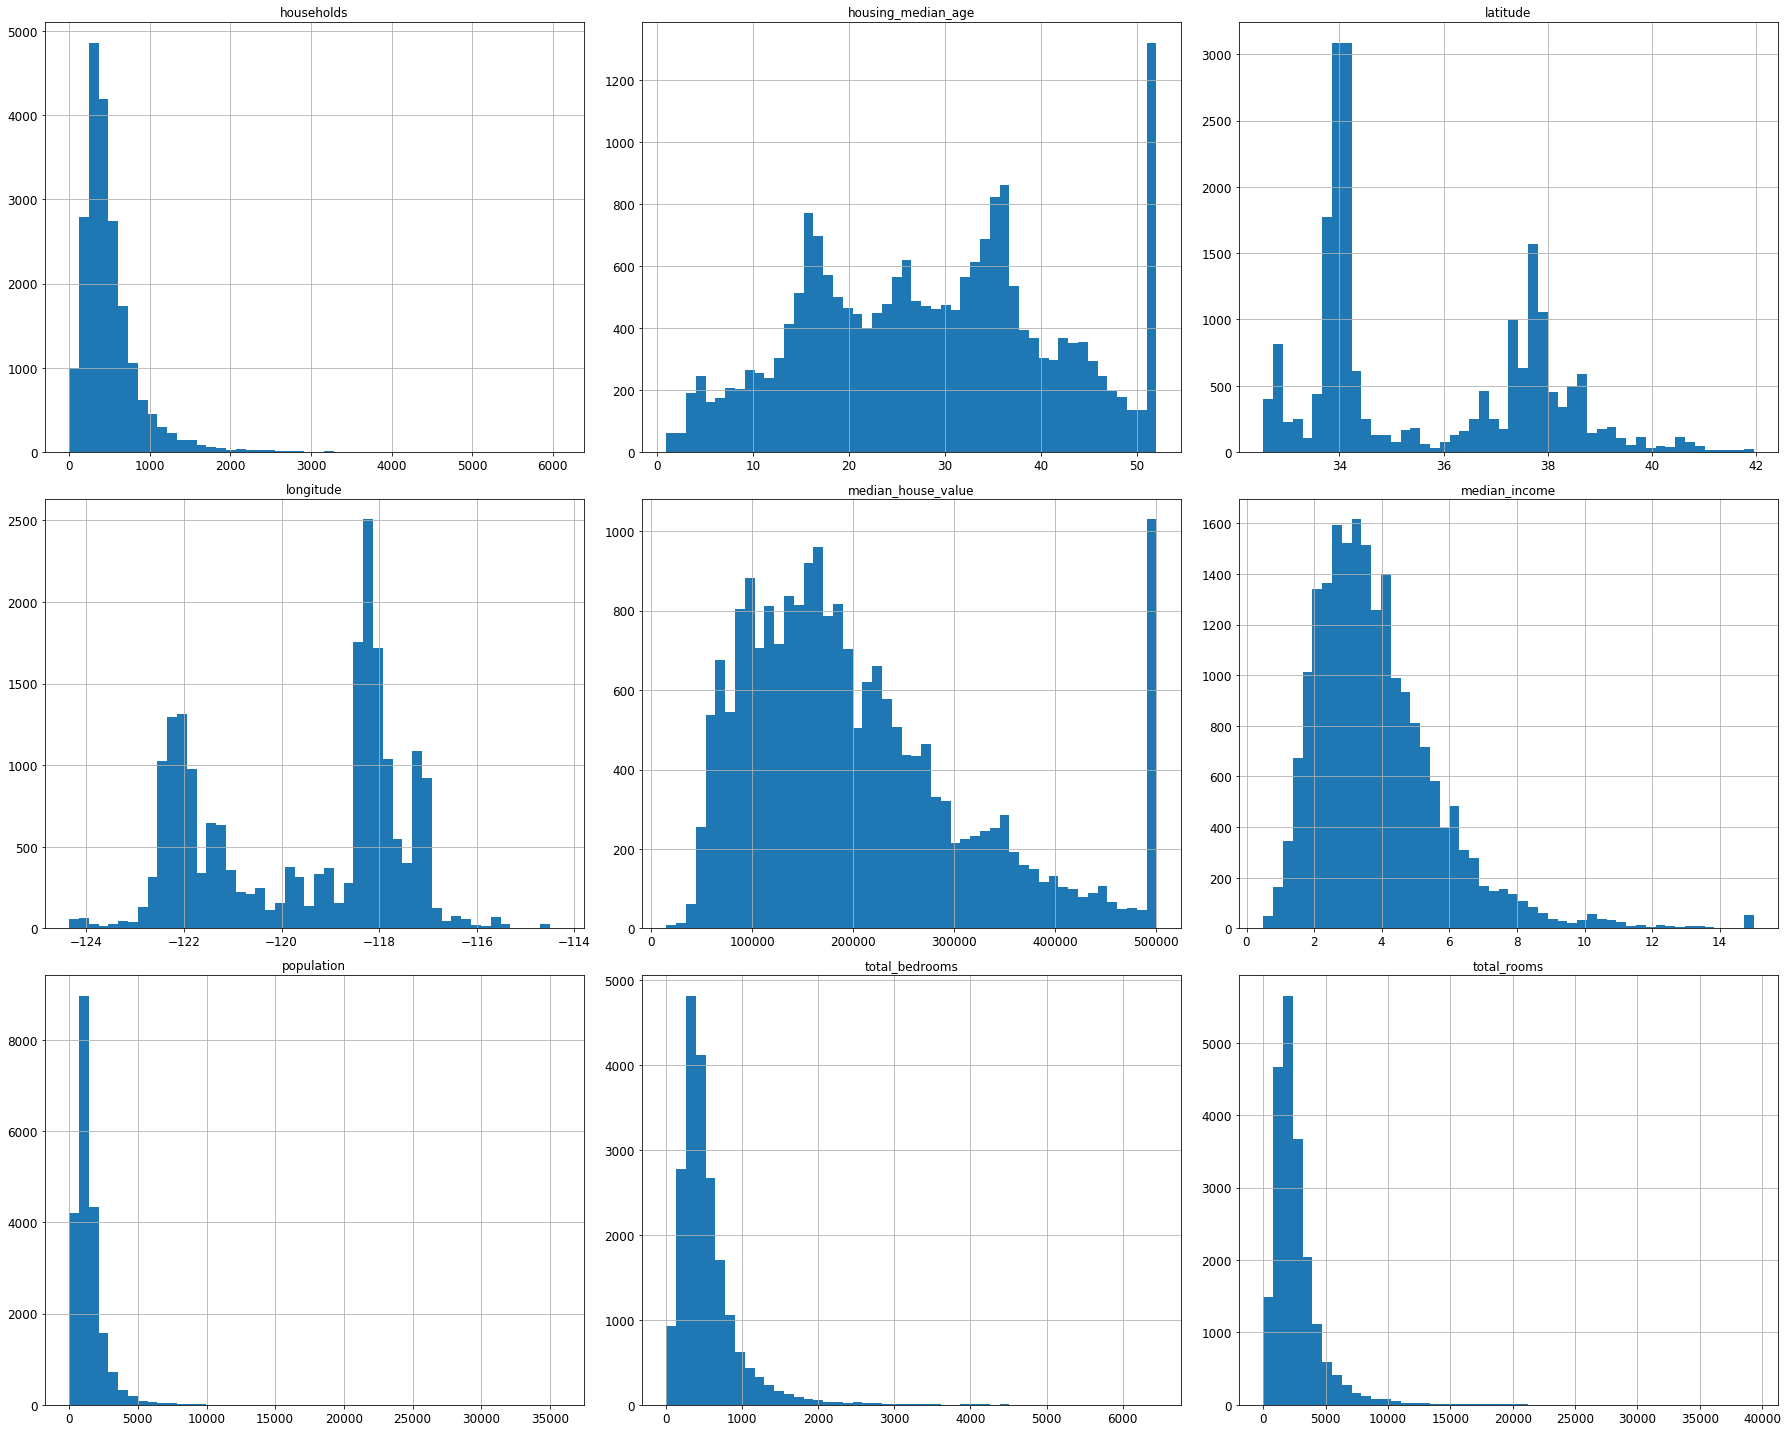
Data Sampling
실제 Model에 넣을 Dataset을 Sampling하는 방법이다.
간단하게 Random하게 20%는 Testset, 80% Trainingset으로서 지정하는 방법이 존재한다.
위와 같은 Sampling은 Sampling Bias가 발생할 수 있다. 즉, Sampling으로 인하여 각각의 Train, Test가 다른 Bias가 생겨서 Model의 정확도를 떨어트릴 수 있다는 이야기이다.
이러한 Sampling Bias의 해결방안으로 계층적 샘플링(Stratified Sampling)이 존재한다.
이번에 사용하는 Dataset에 Staratified Sampling을 적용하면 다음과 같다.
전문가가 중간 소득이 중간 주택 가격을 예측하는 데 매우 중요하다고 이야기해주었다고 가정한다. 이 경우 테스트 세트가 전체 데이터셋에 있는 여러 소득 카테고리를 잘 대표하여야 한다. 중간 소득이 연속적인 숫자형 특성이므로 소득에 대한 카테고리 특성을 만들고 카테고리 별로 비율에 맞게 Train, Test set을 Split하여야 할 것이다.
Stratified Sampling을 위하여 중간 소득(median_income)을 Category로 나누기 위하여 먼저 Visualization하면 다음과 같다.
1
housing["median_income"].hist()
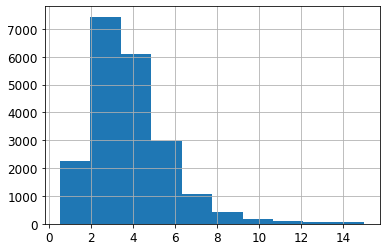
위의 중위수를 Category Value로 나타내는 방법이다.
특정 범위안에 있는 값들을 Count하여 값으로서 표현하였다.
1
2
3
4
5
housing["income_cat"] = pd.cut(housing["median_income"],
                               bins=[0., 1.5, 3.0, 4.5, 6., np.inf],
                               labels=[1, 2, 3, 4, 5])

print(housing["income_cat"].value_counts())
1
2
3
4
5
6
3    7236
2    6581
4    3639
5    2362
1     822
Name: income_cat, dtype: int64
1
housing["income_cat"].hist()
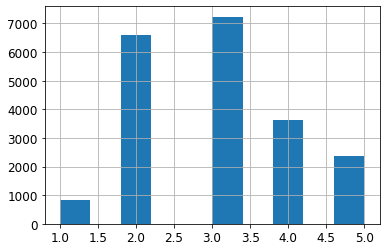
실제 Stratified Sampling을 실시하였을 때 Category별로 비율이 같은지 확인한다.
1
2
3
4
split = StratifiedShuffleSplit(n_splits=1, test_size=0.2, random_state=42)
for train_index, test_index in split.split(housing, housing["income_cat"]):
    strat_train_set = housing.loc[train_index]
    strat_test_set = housing.loc[test_index]
1
2
# Stratifies Sampling
strat_test_set["income_cat"].value_counts() / len(strat_test_set)
1
2
3
4
5
6
3    0.350533
2    0.318798
4    0.176357
5    0.114583
1    0.039729
Name: income_cat, dtype: float64
1
2
# Original Sampling
housing["income_cat"].value_counts() / len(housing)
1
2
3
4
5
6
3    0.350581
2    0.318847
4    0.176308
5    0.114438
1    0.039826
Name: income_cat, dtype: float64
실제 전체 비율에 비하여 RandomSampling과 Stratifies Sampling이 Category별 비율이 차이나는치 확인하면 다음과 같다.
1
2
3
4
5
6
7
8
9
10
11
12
13
14
def income_cat_proportions(data):
    return data["income_cat"].value_counts() / len(data)

train_set, test_set = train_test_split(housing, test_size=0.2, random_state=42)

compare_props = pd.DataFrame({
    "Overall": income_cat_proportions(housing),
    "Stratified": income_cat_proportions(strat_test_set),
    "Random": income_cat_proportions(test_set),
}).sort_index()
compare_props["Rand. %error"] = 100 * compare_props["Random"] / compare_props["Overall"] -100
compare_props["Strat. %error"] = 100 * compare_props["Stratified"] / compare_props["Overall"] -100

compare_props
| Overall | Stratified | Random | Rand. %error | Strat. %error | |
|---|---|---|---|---|---|
| 1 | 0.039826 | 0.039729 | 0.040213 | 0.973236 | -0.243309 |
| 2 | 0.318847 | 0.318798 | 0.324370 | 1.732260 | -0.015195 |
| 3 | 0.350581 | 0.350533 | 0.358527 | 2.266446 | -0.013820 |
| 4 | 0.176308 | 0.176357 | 0.167393 | -5.056334 | 0.027480 |
| 5 | 0.114438 | 0.114583 | 0.109496 | -4.318374 | 0.127011 |
Category로 나누었던 income_cat을 삭제하고 원해 Dataset형태로 변형한다.
1
2
for set_ in (strat_train_set, strat_test_set):
    set_.drop("income_cat", axis=1, inplace=True)
Discover and visualize the data to gain insight
이전 장에서 Feature selection과 Feature Extraction이 매우 중요하다고 하였다.
어떠한 Feature를 사용할 지, 혹은 Feature를 어떻게 조합하여 사용할지, 혹은 Feature를 어떻게 변형할지 사용자가 결정하는데 있어서 Visualization을 통하여 Data의 특성을 살펴보고 결정하는데 도움을 줄 수 있다.
기본적인 Dataset에서 위도와 경도의 관계를 Visualization하면 다음과 같다.
1
2
3
4
5
6
# Dataset copy
housing = strat_train_set.copy()

# Visualization
housing.plot(kind="scatter", x="longitude", y="latitude")
save_fig("bad_visualization_plot")
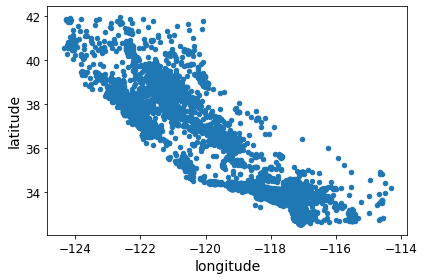
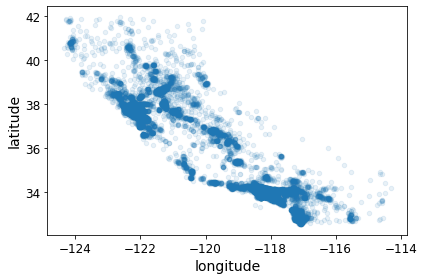
모든 지역을 Visualization하여 확인하기에는 특정한 Pattern을 찾기 힘들다.
alpha=0.1로서 Option을 주어서 밀집된 지역은 색을 더 진하게 하여 알기 쉽게 Visualization하여 결과를 확인한다.
1
2
housing.plot(kind="scatter", x="longitude", y="latitude", alpha=0.1)
save_fig("better_visualization_plot")
상관있다고 생각하는 Feature를 묶어서 Visualization하여 표현한다.
x,y 즉, 경도와 위도에 따라서 인구가 밀집한 곳의 색깔을 진한게 설정한다.
S Option을 사용하여 인구수가 많은 지역은 반지름을 크게 표현한다.
C Option을 사용하여 Median_house_value에 따라서 색깔을 다르게 나타낸다.
1
2
3
4
5
6
housing.plot(kind="scatter", x="longitude", y="latitude", alpha=0.4,
    s=housing["population"]/100, label="population", figsize=(10,7),
    c="median_house_value", cmap=plt.get_cmap("jet"), colorbar=True,
    sharex=False)
plt.legend()
save_fig("housing_prices_scatterplot")
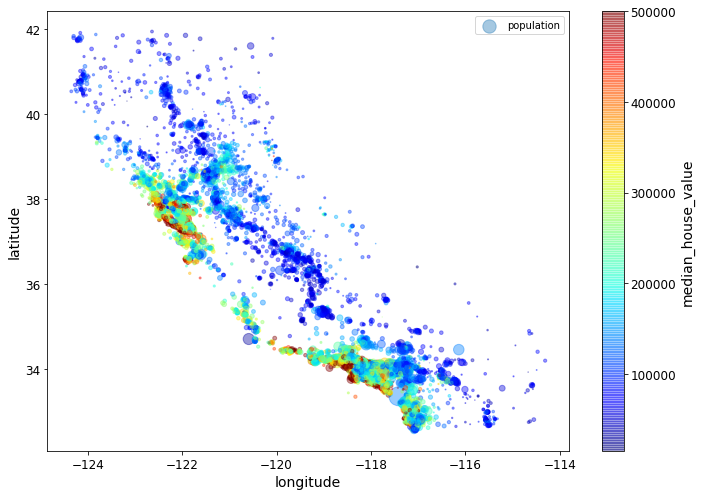
위의 결과를 확인하면 인구가 밀집된 곳이 가격이 높을 수도 있고 아닌 수도 있다.
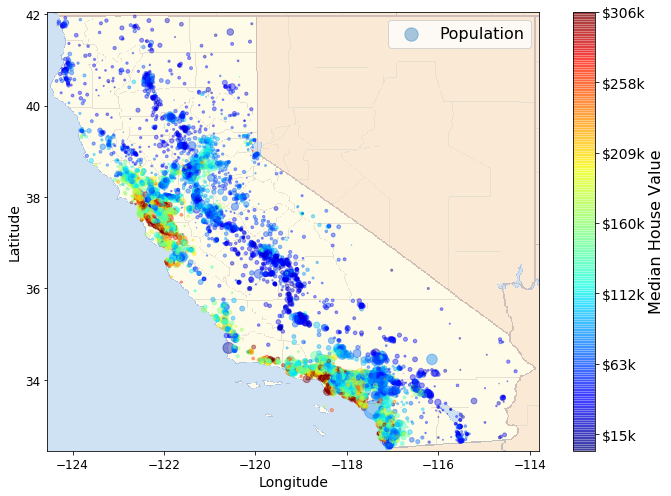
이러한 결과를 확인하기 위해서 실제 Dataset을 모은 Califonia 지도에 Mapping하여 확인하면 더 잘 와닿을 수 있다.
실제 Califonia Image를 다운로드 받고 위도와 경도에 맞게 Mapping하여 결과를 다시한번 확인하면, 바다와 가까운 곳에 인구가 밀집할 수록 가격이 비싸지는 것을 확인할 수 있다.
1
2
3
4
5
6
7
8
# Download the California image
images_path = os.path.join(PROJECT_ROOT_DIR, "images", "end_to_end_project")
os.makedirs(images_path, exist_ok=True)
DOWNLOAD_ROOT = "https://raw.githubusercontent.com/ageron/handson-ml2/master/"
filename = "california.png"
print("Downloading", filename)
url = DOWNLOAD_ROOT + "images/end_to_end_project/" + filename
urllib.request.urlretrieve(url, os.path.join(images_path, filename))
1
2
3
4
5
6
7
8
9
10
11
12
13
14
15
16
17
18
19
20
21
22
california_img=mpimg.imread(os.path.join(images_path, filename))
ax = housing.plot(kind="scatter", x="longitude", y="latitude", figsize=(10,7),
                       s=housing['population']/100, label="Population",
                       c="median_house_value", cmap=plt.get_cmap("jet"),
                       colorbar=False, alpha=0.4,
                      )

# Cut by Latitude, Longitude
plt.imshow(california_img, extent=[-124.55, -113.80, 32.45, 42.05], alpha=0.5,
           cmap=plt.get_cmap("jet"))
plt.ylabel("Latitude", fontsize=14)
plt.xlabel("Longitude", fontsize=14)

prices = housing["median_house_value"]
tick_values = np.linspace(prices.min(), prices.max(), 11)
cbar = plt.colorbar()
cbar.ax.set_yticklabels(["$%dk"%(round(v/1000)) for v in tick_values], fontsize=14)
cbar.set_label('Median House Value', fontsize=16)

plt.legend(fontsize=16)
save_fig("california_housing_prices_plot")
plt.show()
상관관계 조사
데이터셋이 크지 않을 경우 Dataset의 Feature끼리의 피어슨 상관계수를 구하여 확인할 수 있다.
상관계수의 크기는 -1 ~ 1 로서 절댓값이 클 수록 서로 상관관계가 높고 절댓값이 작을수록 서로 상관관계가 낮다.
상관관계가 높은 Feature를 Selection해서 사용하면 더욱 성능이 좋은 Model이 될 것이라고 예측할 수 있다.
또한 상관관계가 낮은 Feature는 Feature Extraction을 통하여 전처리 과정(Outlier 제거 , Feature끼리 합치는 등)을 통하여 더욱 강한 Correlation을 나타낼 수 있다.
1
2
corr_matrix = housing.corr()
corr_matrix["median_house_value"].sort_values(ascending=False)
1
2
3
4
5
6
7
8
9
10
median_house_value    1.000000
median_income         0.687160
total_rooms           0.135097
housing_median_age    0.114110
households            0.064506
total_bedrooms        0.047689
population           -0.026920
longitude            -0.047432
latitude             -0.142724
Name: median_house_value, dtype: float64
몇몇 Feature를 선택하여 Visualization하는 방법은 pandas의 scatter_matrix를 사용하면 쉽게 확인할 수 있다.
1
2
3
4
5
6
7
# from pandas.tools.plotting import scatter_matrix # For older versions of Pandas
from pandas.plotting import scatter_matrix

attributes = ["median_house_value", "median_income", "total_rooms",
              "housing_median_age"]
scatter_matrix(housing[attributes], figsize=(12, 8))
save_fig("scatter_matrix_plot")
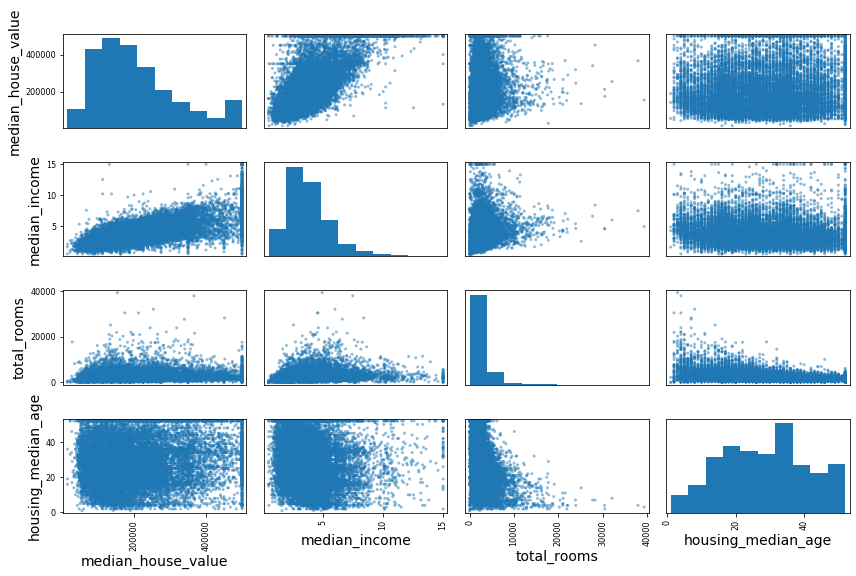
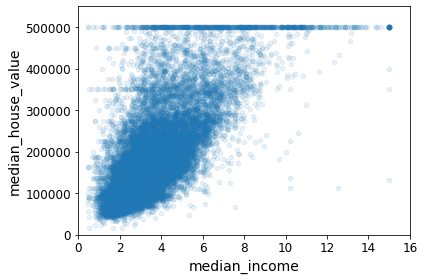
위의 결과를 확인하면 median_house_value와 median_income은 매우 강한 양의 상관관계(0.687160)를 보이는 것을 확인할 수 있다.
이러한 두 Feature에 대하여 Visualization하면 다음과 같다.
1
2
3
housing.plot(kind="scatter", x="median_income", y="median_house_value", alpha=0.1)
plt.axis([0,16,0,550000])
save_fig("income_vs_house_value_scatterplot")
Feature Extraction
위에서는 데이터자체를 Visualization하여 Feature를 선택하는데 도움을 주거나 Correlation을 활용하여 Feature Selection를 실시하였다.
Feature Extraction은 기존의 Feature들을 재조합 하거나 Processing을 통하여 새로운 Feature를 만드는 방법을 의미한다.
아래 새로운 Column을 확인하면 특정 Feature들을 Feature로서 나누어서 나타내었다.
1
2
3
4
5
6
housing["rooms_per_household"] = housing["total_rooms"]/housing["households"]
housing["bedrooms_per_room"] = housing["total_bedrooms"]/housing["total_rooms"]
housing["population_per_household"]=housing["population"]/housing["households"]

corr_matrix = housing.corr()
corr_matrix["median_house_value"].sort_values(ascending=False)
1
2
3
4
5
6
7
8
9
10
11
12
13
median_house_value          1.000000
median_income               0.687160
rooms_per_household         0.146285
total_rooms                 0.135097
housing_median_age          0.114110
households                  0.064506
total_bedrooms              0.047689
population_per_household   -0.021985
population                 -0.026920
longitude                  -0.047432
latitude                   -0.142724
bedrooms_per_room          -0.259984
Name: median_house_value, dtype: float64
위의 결과를 확인하면 bedrooms_per_room(-0.259984)의 절대값이 total_rooms(0.135097)이나 total_bedrooms(0.047689)보다 훨씬 높은 것을 알 수 있다.
이러한 나타나있지 않은 새로운 Feature를 선택하는 방법은 PCA, AutoEncoder등 다양한 방법이 존재한다.
이러한 실제 Model을 설정하기 전에 Data를 탐색하는 다양한 방법을 EDA(Exploratory Data Analysis)라고 부르며, Model의 Performance를 향상하기 위하여 Model자체를 다시 설계하기도 하지만 EDA과정을 다시 거치면서 Data의 Preprocessing 을 향상시키는 방법을 모색하기도 한다.
Preprocessing the data for Machine Learning
Meachine Learning뿐만아니라, 모든 A.I의 과정에서는 Data Preprocessing과정이 필요하다.
Feature와 Label나누기, Test와 Train나누기, NA, Null값 처리하기, Normalization등 많은 Preprocessing과정이 필요하다.
Split Feature, Label
가장 먼저 기본적으로 Model이 Prediction할 Label과 Model이 Prediction할때 근거로 사용하는 Feature.
두가지로 Dataset을 Split한다.
1
2
housing = strat_train_set.drop("median_house_value", axis=1) # drop labels for training set
housing_labels = strat_train_set["median_house_value"].copy()
Handling invalid values
Dataset에서 유효하지 않은 값을 확인한다.
이러한 값들은 특정 값으로 치환되거나 아예 제거할 수도 있다.
1
2
3
# Check invalid Values
sample_incomplete_rows = housing[housing.isnull().any(axis=1)].head()
sample_incomplete_rows
| longitude | latitude | housing_median_age | total_rooms | total_bedrooms | population | households | median_income | ocean_proximity | |
|---|---|---|---|---|---|---|---|---|---|
| 4629 | -118.30 | 34.07 | 18.0 | 3759.0 | NaN | 3296.0 | 1462.0 | 2.2708 | <1H OCEAN |
| 6068 | -117.86 | 34.01 | 16.0 | 4632.0 | NaN | 3038.0 | 727.0 | 5.1762 | <1H OCEAN |
| 17923 | -121.97 | 37.35 | 30.0 | 1955.0 | NaN | 999.0 | 386.0 | 4.6328 | <1H OCEAN |
| 13656 | -117.30 | 34.05 | 6.0 | 2155.0 | NaN | 1039.0 | 391.0 | 1.6675 | INLAND |
| 19252 | -122.79 | 38.48 | 7.0 | 6837.0 | NaN | 3468.0 | 1405.0 | 3.1662 | <1H OCEAN |
위와 같이 Invalid Values는 Pandas의 함수를 사용하여 특정 값으로 대체하거나 아예 없앨 수 있다. 자세한 내용은 링크(Pandas)를 참조하자.
1
2
3
4
5
6
7
8
# sample_incomplete_rows.dropna(subset=["total_bedrooms"])    # option 1: Remove
# sample_incomplete_rows.drop("total_bedrooms", axis=1)       # option 2: Remove

median = housing["total_bedrooms"].median()
sample_incomplete_rows["total_bedrooms"].fillna(median, inplace=True) # option 3: Substitution

# Check Result
sample_incomplete_rows
| longitude | latitude | housing_median_age | total_rooms | total_bedrooms | population | households | median_income | ocean_proximity | |
|---|---|---|---|---|---|---|---|---|---|
| 4629 | -118.30 | 34.07 | 18.0 | 3759.0 | 433.0 | 3296.0 | 1462.0 | 2.2708 | <1H OCEAN |
| 6068 | -117.86 | 34.01 | 16.0 | 4632.0 | 433.0 | 3038.0 | 727.0 | 5.1762 | <1H OCEAN |
| 17923 | -121.97 | 37.35 | 30.0 | 1955.0 | 433.0 | 999.0 | 386.0 | 4.6328 | <1H OCEAN |
| 13656 | -117.30 | 34.05 | 6.0 | 2155.0 | 433.0 | 1039.0 | 391.0 | 1.6675 | INLAND |
| 19252 | -122.79 | 38.48 | 7.0 | 6837.0 | 433.0 | 3468.0 | 1405.0 | 3.1662 | <1H OCEAN |
위와 같은 과정을 sklearn에서 제공하는 SimpleImputer로서 편하게 진행할 수 있다.
- ocean_proximty는 Category Value이므로 제거
- SimpleImputer() Object선언, 어떤값을 사용할지 strategy option으로서 설정(이번 Post에서는 Median으로서 치환) 가능
- imputer.fit()으로서 각각의 Column의 Median값 확인
- imputer.statistics_에 각 Column의 Median값이 Return되있다.
- imputer.transform으로서 Invalid Value를 Median값으로서 치환(Return Type Numpy)
1
2
3
4
5
6
7
8
9
10
11
12
13
14
15
16
17
18
19
20
21
22
23
from sklearn.impute import SimpleImputer
imputer = SimpleImputer(strategy="median")

# Drop Category Value
housing_num = housing.drop("ocean_proximity", axis=1)

imputer.fit(housing_num)

# Check Imputer
print("Imputer(strategy='median')")
print(imputer.statistics_)
print('\n Use Pandas median')
print(housing_num.median().values)

# Transform
X = imputer.transform(housing_num)
print('\n Imputer Type')
print(type(X))

# Numpy -> Pandas
housing_tr = pd.DataFrame(X, columns=housing_num.columns,index=housing.index)
print('\n Check Pandas DataFrame')
print(housing_tr.loc[sample_incomplete_rows.index.values])
1
2
3
4
5
6
7
8
9
10
11
12
13
14
15
16
17
18
19
20
21
22
23
24
25
Imputer(strategy='median')
[-118.51     34.26     29.     2119.5     433.     1164.      408.
    3.5409]

 Use Pandas median
[-118.51     34.26     29.     2119.5     433.     1164.      408.
    3.5409]

 Imputer Type
<class 'numpy.ndarray'>

 Check Pandas DataFrame
       longitude  latitude  housing_median_age  total_rooms  total_bedrooms  \
4629     -118.30     34.07                18.0       3759.0           433.0
6068     -117.86     34.01                16.0       4632.0           433.0
17923    -121.97     37.35                30.0       1955.0           433.0
13656    -117.30     34.05                 6.0       2155.0           433.0
19252    -122.79     38.48                 7.0       6837.0           433.0

       population  households  median_income
4629       3296.0      1462.0         2.2708
6068       3038.0       727.0         5.1762
17923       999.0       386.0         4.6328
13656      1039.0       391.0         1.6675
19252      3468.0      1405.0         3.1662
Handling Category Values
Category Value를 다루기 위해서는 특별한 Preprocessing과정이 필요하다.
이번 Post에서는 2가지 방법에 대하여 다룬다.
- 정수값으로서 Mapping. 즉, <1H OCEAN -> 0, NEAR OCEAN -> 1, 과 같이 정수값으로서 Mapping된다.
- One-Hot-Encoding으로서 Mapping. 주의 하여야 하는 점은 One-Hot-Encoding은 Sparse(0이 많은)형태이다. 따라서 자체적으로 Memory를 절약하기 위하여 특이한 형태로서 저장하게 된다. 따라서 .toarray()를 통하여 사용할 수 있는 형태로 변형해야 한다.
1
2
3
4
5
6
7
8
9
10
11
12
13
14
15
16
17
18
19
20
21
22
# Check Category Values
print('Check Category Values')
housing_cat = housing[["ocean_proximity"]]
print(housing_cat.head(10))

# Category Values ->  Integer Mapping
from sklearn.preprocessing import OrdinalEncoder
ordinal_encoder = OrdinalEncoder()
housing_cat_encoded = ordinal_encoder.fit_transform(housing_cat)
print('\nCategory Values -> Integer Mapping')
for i in housing_cat_encoded[:10]:
    print(i,end=' ')
print('\n\nCategories: ',ordinal_encoder.categories_)

# Category Values -> One-Hot-Encoding
from sklearn.preprocessing import OneHotEncoder
cat_encoder = OneHotEncoder()
housing_cat_1hot = cat_encoder.fit_transform(housing_cat)
print('\nCategory Values -> One Hot Encoding')
for i in housing_cat_1hot[:10]:
    print(i.toarray())
print('\nCategories: ',cat_encoder.categories_)
1
2
3
4
5
6
7
8
9
10
11
12
13
14
15
16
17
18
19
20
21
22
23
24
25
26
27
28
29
30
31
32
33
Check Category Values
      ocean_proximity
17606       <1H OCEAN
18632       <1H OCEAN
14650      NEAR OCEAN
3230           INLAND
3555        <1H OCEAN
19480          INLAND
8879        <1H OCEAN
13685          INLAND
4937        <1H OCEAN
4861        <1H OCEAN

Category Values -> Integer Mapping
[0.] [0.] [4.] [1.] [0.] [1.] [0.] [1.] [0.] [0.]

Categories:  [array(['<1H OCEAN', 'INLAND', 'ISLAND', 'NEAR BAY', 'NEAR OCEAN'],
      dtype=object)]

Category Values -> One Hot Encoding
[[1. 0. 0. 0. 0.]]
[[1. 0. 0. 0. 0.]]
[[0. 0. 0. 0. 1.]]
[[0. 1. 0. 0. 0.]]
[[1. 0. 0. 0. 0.]]
[[0. 1. 0. 0. 0.]]
[[1. 0. 0. 0. 0.]]
[[0. 1. 0. 0. 0.]]
[[1. 0. 0. 0. 0.]]
[[1. 0. 0. 0. 0.]]

Categories:  [array(['<1H OCEAN', 'INLAND', 'ISLAND', 'NEAR BAY', 'NEAR OCEAN'],
      dtype=object)]
위와 같이 Sparse한 형태를 사용하지 않고 바로 사용하고 싶으면 sparse Option을 False로 두면 된다.
1
2
3
cat_encoder = OneHotEncoder(sparse=False)
housing_cat_1hot = cat_encoder.fit_transform(housing_cat)
housing_cat_1hot
1
2
3
4
5
6
7
array([[1., 0., 0., 0., 0.],
       [1., 0., 0., 0., 0.],
       [0., 0., 0., 0., 1.],
       ...,
       [0., 1., 0., 0., 0.],
       [1., 0., 0., 0., 0.],
       [0., 0., 0., 1., 0.]])
참조
그렇다면 우리는 왜 OneHotEncoder와 정수값으로서 Mapping하는지에 대한 차이에 대하여 의문이 생길 수 밖에 없다.
만약 Label에 대하여 OneHotEncoder를 사용하는 이유는 개인적으로 Activation Function을 Softmax로서 사용하고 LossFunction을 CrossEntropy로 사용하기 위해서 라고 생각한다.
이러한 결과는 Softmax-with-Loss에서 살펴보게 되면 Parameter의 Update가 빠르게 진행되고, 여러가지 Category에 대하여 분류할 수 있다는 장점이 생기게 된다.
Customize Preprocessing
위에서 Correlation을 구하는 경우 Feature Extraction을 진행한 것을 알 수 있다.
sklearn에서는 이러한 Feature Extraction및 다양한 작업을 연동하여 사용할 수 있다.
- TransformerMixin: fit(), transform(), fit_transform() Method사용 가능
- BaseEstimator: get_params(), set_params() -> Hyperparameter Tuning에서 사용 가능
1
2
3
4
5
6
7
8
9
10
11
12
13
14
15
16
17
18
19
20
21
22
from sklearn.base import BaseEstimator, TransformerMixin

# column index
rooms_ix, bedrooms_ix, population_ix, households_ix = 3, 4, 5, 6

class CombinedAttributesAdder(BaseEstimator, TransformerMixin):
    def __init__(self, add_bedrooms_per_room = True): # no *args or **kargs
        self.add_bedrooms_per_room = add_bedrooms_per_room
    def fit(self, X, y=None):
        return self  # nothing else to do
    def transform(self, X):
        rooms_per_household = X[:, rooms_ix] / X[:, households_ix]
        population_per_household = X[:, population_ix] / X[:, households_ix]
        if self.add_bedrooms_per_room:
            bedrooms_per_room = X[:, bedrooms_ix] / X[:, rooms_ix]
            return np.c_[X, rooms_per_household, population_per_household,
                         bedrooms_per_room]
        else:
            return np.c_[X, rooms_per_household, population_per_household]

attr_adder = CombinedAttributesAdder(add_bedrooms_per_room=False)
housing_extra_attribs = attr_adder.transform(housing.values)
위의 Class를 살펴보게 되면 init, fit(), transform() Method를 가지고 있고, transorm()수행시, 위에서 수행하였던 Feature Extraction을 수행하는 것을 알 수 있다.
수행 결과는 Numpy로서 Return되므로 Pandas로 바꾸어서 확인하면 다음과 같다.
1
2
3
4
5
6
# Numpy -> Pandas
housing_extra_attribs = pd.DataFrame(
    housing_extra_attribs,
    columns=list(housing.columns)+["rooms_per_household", "population_per_household"],
    index=housing.index)
housing_extra_attribs.head()
| longitude | latitude | housing_median_age | total_rooms | total_bedrooms | population | households | median_income | ocean_proximity | rooms_per_household | population_per_household | |
|---|---|---|---|---|---|---|---|---|---|---|---|
| 17606 | -121.89 | 37.29 | 38 | 1568 | 351 | 710 | 339 | 2.7042 | <1H OCEAN | 4.62537 | 2.0944 |
| 18632 | -121.93 | 37.05 | 14 | 679 | 108 | 306 | 113 | 6.4214 | <1H OCEAN | 6.00885 | 2.70796 |
| 14650 | -117.2 | 32.77 | 31 | 1952 | 471 | 936 | 462 | 2.8621 | NEAR OCEAN | 4.22511 | 2.02597 |
| 3230 | -119.61 | 36.31 | 25 | 1847 | 371 | 1460 | 353 | 1.8839 | INLAND | 5.23229 | 4.13598 |
| 3555 | -118.59 | 34.23 | 17 | 6592 | 1525 | 4459 | 1463 | 3.0347 | <1H OCEAN | 4.50581 | 3.04785 |
PipeLine & Numerical Attributes
Numeric Feature들은 각각의 Scale이 다르다.
즉, 숫자가 크게 되면 Model에서 영향을 많이 받을 것이 당연하므로 각각의 Feature들을 Normalization하는 작업이 필요하게 된다.
이러한 Normalization작업은 sklearn.preprocessing.StandardScalar로서 가능하다.(Z변환)
PipeLine이란 일련의 작업을 순서대로 진행하는 것이라고 할 수 있다.
위에서 작업을 생각해 본다면 다음과 같다.
- Stratified Sampling
- Split Train & Test
- Invalid Value를 특정값으로 치환 혹은 Drop하여 없앰
- Feature Extractor를 통하여 Feature를 조합
- Numeric Value는 Normalization 수행
- Category Value는 One-Hot-Encoding or 정수형으로 Mapping
각각의 단계는 전부 Estimator(SimpleImputer, CombinedAttributesAdder, …)으로 이루워져 있었다.
PipeLine이란 이러한 Estimator를 순서대로 묶어서 작업을 진행하는 것을 지칭한다.
즉, PipeLine으로 묶으면 fit()을 수행시 지정한 순서대로 Estimator에서 fit()을 수행하게 되고 transorm()또한 마찬가지 지정한 순서대로 Estimator에서 transform()을 수행하게 된다.
이러한 각각의 PipeLine은 FeatureUnion으로 하나의 PipeLine으로 묶을 수 있다.
FeatureUnion은 fit()을 수행하게 되면 병렬적으로 PipeLine들이 fit()을 수행하게 된다.
즉, FeatureUnion안의 PipeLine들은 서로 병렬적으로 작동하지만, PipeLine내에 있는 Estimator들은 직렬적으로 순서대로 작동된다.
아래 Code의 순서는 다음과 같다.
- num_pipeline: DataFrameSelector -> SimpleImputer -> CombineAttributesAddr -> StandardScalar Estimator를 순서대로 실시한다.
- DataFrameSelector: Numeric or Category Feature를 뽑아낸다. (Numeric)
- SimpleImputer: Invalid Value를 가지고 있는 Feature를 전처리 한다. (중위수로 대체)
- CombineAttributesAddr: Feature Extractor과정을 거쳐서 새로운 Feature를 추가한다.
- StandardScalar: Normalization을 수행한다.
- cat_pipeline: DataframeSelector -> OneHotEncoding Extimator를 순서대로 실시한다.
- DataframeSelector: Numeric or Category Feature를 뽑아낸다. (Category)
- OneHotEncoding: Category Value를 One-Hot-Encoding으로서 표현한다.
- Numeric Feature를 다룰 num_pipeline과 Category Feature를 다룰 cat_pipeline을 FeatureUnion으로서 하나의 PipeLine으로서 합친다.
1
2
3
4
5
6
7
8
9
10
11
12
13
14
15
16
17
18
19
20
21
22
23
24
25
26
27
28
29
30
31
32
33
34
35
36
37
38
39
40
from sklearn.pipeline import Pipeline
from sklearn.preprocessing import StandardScaler
from sklearn.pipeline import FeatureUnion

# Estimator(DataFrameSelector)
class DataFrameSelector(BaseEstimator, TransformerMixin):
    def __init__(self, attribute_names):
        self.attribute_names = attribute_names
    def fit(self, X, y=None):
        return self
    def transform(self, X):
        return X[self.attribute_names].values

# Split Numeric & Category Feature
num_attribs = list(housing_num)
cat_attribs = ["ocean_proximity"]

# Numeric PipeLine
# Numeric Feature Select -> Invalid Value processing -> Feature Extractor -> Normalization
num_pipeline = Pipeline([
        ('selector', DataFrameSelector(num_attribs)),
        ('imputer', SimpleImputer(strategy="median")),
        ('attribs_adder', CombinedAttributesAdder()),
        ('std_scaler', StandardScaler()),
])

# Category Pipeline
# Category Feature Select -> One-Hot-Encoding
cat_pipeline = Pipeline([
        ('selector', DataFrameSelector(cat_attribs)),
        ('cat_encoder', OneHotEncoder(sparse=False)),
])

# FeatureUnion -> Num_Pipeline + Cat_Pipeline
full_pipeline = FeatureUnion(transformer_list=[
        ("num_pipeline", num_pipeline),
        ("cat_pipeline", cat_pipeline),
    ])

housing_prepared = full_pipeline.fit_transform(housing)
전처리 결과를 살펴보게 되면 최종적인 Shape는 (16512,16) 이다.
원래 housing은 (16512,9)인데 CombinedAttributesAddr()로 인하여 3개의 Feature가 추가 되었고, One-Hot-Encoding에서 ocean_proximity가 4개의 Category를 가지고 있어 4차원의 One-Hot-Encoding으로서 표현되었다.
결과적으로 9+3+4 = 16으로 결과가 표현되었다.
1
housing_prepared.shape
1
(16512, 16)
Select and train a model
실질적으로 Model을 선택하고 Train하여야 한다.
Prediction에 사용할 Model은 사용자가 선택할 수 있다.
먼저 LinearRegression Model을 사용(Label이 Continuous Value이므로)하고 Trainingset을 통하여 오차를 MAE를 사용하여 구하여 보자.
1
2
3
4
5
6
7
8
9
from sklearn.linear_model import LinearRegression
from sklearn.metrics import mean_absolute_error

lin_reg = LinearRegression()
lin_reg.fit(housing_prepared,housing_labels)
housing_predictions = lin_reg.predict(housing_prepared)

lin_mae = mean_absolute_error(housing_labels,housing_predictions)
print('Linear Regression MAE Error: ',lin_mae)
1
Linear Regression MAE Error:  49439.895990018966
위의 RMSE Error는 상당히 큰 값을 가지는 것을 알 수 있다.
이러한 결과는 Model이 Underfitting되었다고 말할 수 있다.
후반부에 배울 DecisssionRegressor를 통하여 Model을 만들고 MAE를 사용하여 오차를 구하여 보자.
1
2
3
4
5
6
7
8
from sklearn.tree import DecisionTreeRegressor

tree_reg = DecisionTreeRegressor(random_state=42)
tree_reg.fit(housing_prepared,housing_labels)

housing_predictions = tree_reg.predict(housing_prepared)
tree_mae = mean_absolute_error(housing_labels,housing_predictions)
print('Decision Tree Regressor MAE Error',tree_mae)
1
Decision Tree Regressor MAE Error 0.0
위의 결과는 2가지로 해석할 수 있다.
Model이 Dtaset에 맞게 잘 Training되어서 MAE Error가 0이 나왔다.
혹은 Overfitting되어서 Model의 MAE Error가 0이 나왔다.
위와 같이 Overfitting에 대해서는 Validation Dataset으로서 확인하는 것이 일반적이다.
이러한 Model의 세부 Tuning방법 및 결과 해석방법에 대하여 알아보자.
Cross Validation
Cross Validation을 통하여 교차검증을 하여 Overfitting되었는지 살펴본다.
대표 적인 K-Fold Cross Validation이 있으며 sklearn에서는 cross_val_score로서 계산할 수 있다.
cv option으로서 몇개로 분할할지 사용자가 지정할 수 있으며, Score가 높을수록 Error가 적다는 것을 알 수 있다.
참고사항으로서, 책에서는 scoreing option을 meg_mean_squared_error로서 사용하였지만, Normalization되어있지 않아 값 비교가 와닿지 않아서 r2_scoring을 통하여 계산하고 결과를 호가인하였다.
1
2
3
4
def display_scores(scores):
    print("Scores:", scores)
    print("Mean:", scores.mean())
    print("Standard deviation:", scores.std())
1
2
3
4
5
6
7
8
9
10
11
from sklearn.model_selection import cross_val_score

# Decision Tree
print('Decision Tree')
tree_scores = cross_val_score(tree_reg, housing_prepared, housing_labels, cv=10)
display_scores(tree_scores)

# LinearRegression
print('\n\nLinearRegression')
lin_scores = cross_val_score(lin_reg, housing_prepared, housing_labels, cv=10)
display_scores(lin_scores)
1
2
3
4
5
6
7
8
9
10
11
12
Decision Tree
Scores: [0.58914094 0.67468467 0.60318564 0.6375226  0.61979213 0.58940747
 0.62656279 0.64315294 0.58530983 0.60995462]
Mean: 0.6178713633732397
Standard deviation: 0.02703061229189363


LinearRegression
Scores: [0.62810772 0.67366246 0.62569782 0.59558993 0.65206084 0.63573031
 0.68070897 0.66309703 0.6262189  0.64803579]
Mean: 0.6428909748300279
Standard deviation: 0.024447282122050846
위의 결과를 살펴보게 되면 10번의 Cross-Validation을 통하여 평균과 편차를 확인하였을 때 Linear Model이 평균이 높은 것을 확인할 수 있다.
즉, Linear Model이 더 적합하며 Decision Tree Linear Regression에 비하여 분산이 더 높다. 이것은 Decision Tree가 Linear Regression에 비하여 더 Overfitting되었다는 것을 확인할 수 있다.
Cross-validation은 결국 여러번의 검증을 하는 작업이므로, 시간이 오래 걸린다는 단점이 발생한다.
Fine-tune your model
위에서는 어떻게 Model을 선택하는지에 대략적인 방법에 대해서 알아보았다.
이번에는 이러한 대략적인 Model의 Fine-tune을 통하여 성능을 향상시키는 법에 대하여 알아본다.
Grid Search
Model의 적합한 하이퍼파라미터 조합을 찾을 때 까지 수동으로 조합을 하는 방법이다.
앙상블 학습 방법인 Random Forest를 기준으로 Grid Search를 적용하여 본다.
아래 Code를 확인하면 다음과 같다.
1
2
3
4
5
6
param_grid = [
    # try 12 (3×4) combinations of hyperparameters
    {'n_estimators': [3, 10, 30], 'max_features': [2, 4, 6, 8]},
    # then try 6 (2×3) combinations with bootstrap set as False
    {'bootstrap': [False], 'n_estimators': [3, 10], 'max_features': [2, 3, 4]},
  ]
정확한 Parameter의 의미에 대해서는 나중에 알아보도록 하자.
중요한것은 GridSearch를 하게 되면 Dict형태의 Parameter를 지정한 값의 모든 조합을 통하여 Error를 최소화하는 Parameter를 선정해준다는 것 이다.
Parameter의 개수를 늘림에 따라서 CrossValidation의 cv를 늘리는 것과 같이 많은 시간이 걸린다는 단점이 발생하게 된다.
위의 Code를 예를 들면 총 3x4 + 2x3 = 18개의 Model을 만들게 되고 CrossValidation을 5번으로서 판단하기 때문에 총 90번의 연산이 소요되게 된다.
1
2
3
4
5
6
7
8
9
10
11
12
13
14
15
16
17
18
19
20
21
22
23
24
25
26
27
28
from sklearn.ensemble import RandomForestRegressor
from sklearn.model_selection import GridSearchCV

# Simple Random Forest
forest_reg = RandomForestRegressor(n_estimators=10, max_features=4, random_state=42)
forest_reg.fit(housing_prepared, housing_labels)
forest_predictions = forest_reg.predict(housing_prepared)
simple_forest_scores = cross_val_score(forest_reg, housing_prepared, housing_labels, cv=5)
print('Simple Random Forest Error')
display_scores(simple_forest_scores)

# Grid Search
param_grid = [
    # try 12 (3×4) combinations of hyperparameters
    {'n_estimators': [3, 10, 30], 'max_features': [2, 4, 6, 8]},
    # then try 6 (2×3) combinations with bootstrap set as False
    {'bootstrap': [False], 'n_estimators': [3, 10], 'max_features': [2, 3, 4]},
  ]
forest_reg = RandomForestRegressor(random_state=42)
# train across 5 folds, that's a total of (12+6)*5=90 rounds of training
grid_search = GridSearchCV(forest_reg, param_grid, cv=5,return_train_score=True)
grid_search.fit(housing_prepared, housing_labels)
print('\n\Grid Search')

print('Best Parameter: ',grid_search.best_params_)
print('Best Estimator', grid_search.best_estimator_)
print('\n\nRandom Search Random Forest Error')
print(grid_search.cv_results_["mean_test_score"][grid_search.best_index_])
1
2
3
4
5
6
7
8
9
10
11
12
13
14
15
16
17
18
Simple Random Forest Error
Scores: [0.79287631 0.79401653 0.78770447 0.80667166 0.77922501]
Mean: 0.7920987968798725
Standard deviation: 0.008963205400307563

\Grid Search
Best Parameter:  {'max_features': 8, 'n_estimators': 30}
Best Estimator RandomForestRegressor(bootstrap=True, ccp_alpha=0.0, criterion='mse',
                      max_depth=None, max_features=8, max_leaf_nodes=None,
                      max_samples=None, min_impurity_decrease=0.0,
                      min_impurity_split=None, min_samples_leaf=1,
                      min_samples_split=2, min_weight_fraction_leaf=0.0,
                      n_estimators=30, n_jobs=None, oob_score=False,
                      random_state=42, verbose=0, warm_start=False)


Random Search Random Forest Error
0.8155398647643569
최종적인 결과를 살펴보게 되면 0.02정도 향상된 것을 알 수 있다.
Grid Search에 대한 자세한 결과를 살펴보면 다음과 같다.
1
pd.DataFrame(grid_search.cv_results_)
| mean_fit_time | std_fit_time | mean_score_time | std_score_time | param_max_features | param_n_estimators | param_bootstrap | params | split0_test_score | split1_test_score | ... | mean_test_score | std_test_score | rank_test_score | split0_train_score | split1_train_score | split2_train_score | split3_train_score | split4_train_score | mean_train_score | std_train_score | |
|---|---|---|---|---|---|---|---|---|---|---|---|---|---|---|---|---|---|---|---|---|---|
| 0 | 0.050262 | 0.000961 | 0.002402 | 4.902907e-04 | 2 | 3 | NaN | {'max_features': 2, 'n_estimators': 3} | 0.701884 | 0.693219 | ... | 0.697073 | 0.008765 | 18 | 0.921239 | 0.917233 | 0.916215 | 0.916669 | 0.915649 | 0.917401 | 1.988492e-03 |
| 1 | 0.162055 | 0.001112 | 0.006606 | 4.902518e-04 | 2 | 10 | NaN | {'max_features': 2, 'n_estimators': 10} | 0.763241 | 0.759223 | ... | 0.768671 | 0.010465 | 11 | 0.956130 | 0.956031 | 0.956650 | 0.957176 | 0.956672 | 0.956532 | 4.152278e-04 |
| 2 | 0.486259 | 0.003194 | 0.020018 | 1.507891e-07 | 2 | 30 | NaN | {'max_features': 2, 'n_estimators': 30} | 0.791097 | 0.776516 | ... | 0.787032 | 0.011009 | 9 | 0.967573 | 0.967112 | 0.967195 | 0.967210 | 0.966752 | 0.967169 | 2.618771e-04 |
| 3 | 0.079873 | 0.000981 | 0.002002 | 4.768372e-07 | 4 | 3 | NaN | {'max_features': 4, 'n_estimators': 3} | 0.710230 | 0.719866 | ... | 0.722063 | 0.014369 | 16 | 0.926982 | 0.924166 | 0.931194 | 0.922284 | 0.927512 | 0.926427 | 3.049105e-03 |
| 4 | 0.259253 | 0.002298 | 0.007006 | 9.536743e-08 | 4 | 10 | NaN | {'max_features': 4, 'n_estimators': 10} | 0.792876 | 0.794017 | ... | 0.792099 | 0.008963 | 8 | 0.962273 | 0.961334 | 0.962759 | 0.959275 | 0.961468 | 0.961422 | 1.194296e-03 |
| 5 | 0.772604 | 0.004820 | 0.019818 | 4.004002e-04 | 4 | 30 | NaN | {'max_features': 4, 'n_estimators': 30} | 0.814560 | 0.808520 | ... | 0.810360 | 0.007617 | 3 | 0.971587 | 0.970940 | 0.971554 | 0.969727 | 0.971285 | 0.971019 | 6.861082e-04 |
| 6 | 0.107010 | 0.003267 | 0.002402 | 4.903881e-04 | 6 | 3 | NaN | {'max_features': 6, 'n_estimators': 3} | 0.757657 | 0.734703 | ... | 0.742930 | 0.010708 | 14 | 0.931570 | 0.933443 | 0.929815 | 0.932503 | 0.935599 | 0.932586 | 1.925174e-03 |
| 7 | 0.350919 | 0.003265 | 0.007006 | 1.907349e-07 | 6 | 10 | NaN | {'max_features': 6, 'n_estimators': 10} | 0.801936 | 0.794199 | ... | 0.797870 | 0.010256 | 6 | 0.963138 | 0.962210 | 0.962521 | 0.962615 | 0.962250 | 0.962547 | 3.334542e-04 |
| 8 | 1.064000 | 0.005994 | 0.020018 | 1.168008e-07 | 6 | 30 | NaN | {'max_features': 6, 'n_estimators': 30} | 0.815892 | 0.808876 | ... | 0.812080 | 0.008584 | 2 | 0.971589 | 0.971505 | 0.971446 | 0.971112 | 0.970864 | 0.971303 | 2.727837e-04 |
| 9 | 0.134858 | 0.000571 | 0.002402 | 4.902128e-04 | 8 | 3 | NaN | {'max_features': 8, 'n_estimators': 3} | 0.739491 | 0.752292 | ... | 0.749594 | 0.011258 | 13 | 0.931697 | 0.935944 | 0.935442 | 0.933461 | 0.931667 | 0.933642 | 1.802903e-03 |
| 10 | 0.449350 | 0.004199 | 0.007206 | 4.004002e-04 | 8 | 10 | NaN | {'max_features': 8, 'n_estimators': 10} | 0.800203 | 0.798863 | ... | 0.800149 | 0.009707 | 5 | 0.963492 | 0.963937 | 0.964499 | 0.961379 | 0.962773 | 0.963216 | 1.078449e-03 |
| 11 | 1.355447 | 0.006686 | 0.020018 | 1.907349e-07 | 8 | 30 | NaN | {'max_features': 8, 'n_estimators': 30} | 0.816872 | 0.811613 | ... | 0.815540 | 0.007026 | 1 | 0.971566 | 0.971956 | 0.971686 | 0.970916 | 0.971550 | 0.971535 | 3.418569e-04 |
| 12 | 0.077461 | 0.001320 | 0.002602 | 4.901350e-04 | 2 | 3 | False | {'bootstrap': False, 'max_features': 2, 'n_est... | 0.705908 | 0.691820 | ... | 0.704356 | 0.013103 | 17 | 1.000000 | 1.000000 | 1.000000 | 1.000000 | 1.000000 | 1.000000 | 0.000000e+00 |
| 13 | 0.257642 | 0.001629 | 0.008408 | 4.903296e-04 | 2 | 10 | False | {'bootstrap': False, 'max_features': 2, 'n_est... | 0.781656 | 0.770102 | ... | 0.776764 | 0.009867 | 10 | 1.000000 | 1.000000 | 1.000000 | 1.000000 | 1.000000 | 1.000000 | 8.820116e-11 |
| 14 | 0.102109 | 0.002953 | 0.003003 | 1.168008e-07 | 3 | 3 | False | {'bootstrap': False, 'max_features': 3, 'n_est... | 0.718919 | 0.745414 | ... | 0.735538 | 0.009297 | 15 | 1.000000 | 1.000000 | 1.000000 | 1.000000 | 1.000000 | 1.000000 | 1.813848e-09 |
| 15 | 0.333703 | 0.003444 | 0.008608 | 4.904270e-04 | 3 | 10 | False | {'bootstrap': False, 'max_features': 3, 'n_est... | 0.785752 | 0.789044 | ... | 0.792180 | 0.005641 | 7 | 1.000000 | 1.000000 | 1.000000 | 1.000000 | 1.000000 | 1.000000 | 5.990365e-10 |
| 16 | 0.126413 | 0.002727 | 0.002803 | 4.002571e-04 | 4 | 3 | False | {'bootstrap': False, 'max_features': 4, 'n_est... | 0.756540 | 0.736696 | ... | 0.753023 | 0.012456 | 12 | 1.000000 | 1.000000 | 1.000000 | 1.000000 | 1.000000 | 1.000000 | 0.000000e+00 |
| 17 | 0.414609 | 0.001618 | 0.008207 | 4.004002e-04 | 4 | 10 | False | {'bootstrap': False, 'max_features': 4, 'n_est... | 0.803807 | 0.799528 | ... | 0.805497 | 0.008284 | 4 | 1.000000 | 1.000000 | 1.000000 | 1.000000 | 1.000000 | 1.000000 | 4.535927e-13 |
18 rows × 23 columns
RandomSearch
Grid한 Search방법 즉 모든 조합을 선택해서 Parameter를 정하는 방법이 아니라, Random하게 Parameter를 선택하는 방법이다.
Argument로서 범위를 지정하고 몇번 반복(n_iter option)할지에 대해서 지정을 하게 되었을 경우 Argument에 맞게 Model을 Training하는 방법이다.
GridSearch와 동일하게 Error값을 살펴보면 다음과 같다.
1
2
3
4
5
6
7
8
9
10
11
12
13
14
15
16
17
18
19
20
21
22
23
from sklearn.model_selection import RandomizedSearchCV
from scipy.stats import randint

# Simple Random Forest Error
print('Simple Random Forest Error')
display_scores(simple_forest_scores)

# Random Search
param_distribs = {
        'n_estimators': randint(low=1, high=200),
        'max_features': randint(low=1, high=8),
    }

forest_reg = RandomForestRegressor(random_state=42)
rnd_search = RandomizedSearchCV(forest_reg, param_distributions=param_distribs,
                                n_iter=10, cv=5, random_state=42)
rnd_search.fit(housing_prepared, housing_labels)
print('\n\nRandom Search')

print('Best Parameter: ',rnd_search.best_params_)
print('Best Estimator', rnd_search.best_estimator_)
print('\n\nRandom Search Random Forest Error')
print(rnd_search.cv_results_["mean_test_score"][rnd_search.best_index_])
1
2
3
4
5
6
7
8
9
10
11
12
13
14
15
16
17
18
19
Simple Random Forest Error
Scores: [0.79287631 0.79401653 0.78770447 0.80667166 0.77922501]
Mean: 0.7920987968798725
Standard deviation: 0.008963205400307563


Random Search
Best Parameter:  {'max_features': 7, 'n_estimators': 180}
Best Estimator RandomForestRegressor(bootstrap=True, ccp_alpha=0.0, criterion='mse',
                      max_depth=None, max_features=7, max_leaf_nodes=None,
                      max_samples=None, min_impurity_decrease=0.0,
                      min_impurity_split=None, min_samples_leaf=1,
                      min_samples_split=2, min_weight_fraction_leaf=0.0,
                      n_estimators=180, n_jobs=None, oob_score=False,
                      random_state=42, verbose=0, warm_start=False)


Random Search Random Forest Error
0.8194857614404034
최종적인 결과를 살펴보게 되면 0.02정도 향상된 것을 알 수 있다. Random Search에 대한 자세한 결과를 살펴보면 다음과 같다.
1
pd.DataFrame(rnd_search.cv_results_)
| mean_fit_time | std_fit_time | mean_score_time | std_score_time | param_max_features | param_n_estimators | params | split0_test_score | split1_test_score | split2_test_score | split3_test_score | split4_test_score | mean_test_score | std_test_score | rank_test_score | |
|---|---|---|---|---|---|---|---|---|---|---|---|---|---|---|---|
| 0 | 7.285215 | 0.030999 | 0.117335 | 2.448809e-03 | 7 | 180 | {'max_features': 7, 'n_estimators': 180} | 0.823290 | 0.816904 | 0.812223 | 0.832915 | 0.812096 | 0.819486 | 0.007859 | 1 |
| 1 | 0.460609 | 0.002488 | 0.010209 | 4.002333e-04 | 5 | 15 | {'max_features': 5, 'n_estimators': 15} | 0.806323 | 0.798260 | 0.798322 | 0.814896 | 0.795478 | 0.802656 | 0.007112 | 9 |
| 2 | 1.498902 | 0.006500 | 0.047043 | 1.784161e-07 | 3 | 72 | {'max_features': 3, 'n_estimators': 72} | 0.811057 | 0.802492 | 0.804476 | 0.821447 | 0.796429 | 0.807180 | 0.008526 | 7 |
| 3 | 0.643541 | 0.004283 | 0.014213 | 4.005194e-04 | 5 | 21 | {'max_features': 5, 'n_estimators': 21} | 0.811585 | 0.801346 | 0.802939 | 0.819309 | 0.799331 | 0.806902 | 0.007480 | 8 |
| 4 | 4.918610 | 0.009411 | 0.079072 | 6.330883e-04 | 7 | 122 | {'max_features': 7, 'n_estimators': 122} | 0.821654 | 0.815795 | 0.811557 | 0.831857 | 0.811749 | 0.818522 | 0.007609 | 2 |
| 5 | 1.566894 | 0.015497 | 0.048445 | 4.919694e-04 | 3 | 75 | {'max_features': 3, 'n_estimators': 75} | 0.811497 | 0.803020 | 0.804150 | 0.821501 | 0.796557 | 0.807345 | 0.008520 | 6 |
| 6 | 1.836364 | 0.007790 | 0.057252 | 7.489909e-04 | 3 | 88 | {'max_features': 3, 'n_estimators': 88} | 0.811872 | 0.803916 | 0.804464 | 0.822280 | 0.797677 | 0.808042 | 0.008422 | 5 |
| 7 | 3.089097 | 0.015420 | 0.064459 | 8.007288e-04 | 5 | 100 | {'max_features': 5, 'n_estimators': 100} | 0.821857 | 0.812251 | 0.809510 | 0.829182 | 0.807794 | 0.816119 | 0.008143 | 3 |
| 8 | 3.130057 | 0.010949 | 0.097487 | 1.358044e-03 | 3 | 150 | {'max_features': 3, 'n_estimators': 150} | 0.813725 | 0.805757 | 0.804997 | 0.824044 | 0.799619 | 0.809628 | 0.008499 | 4 |
| 9 | 0.064257 | 0.001165 | 0.002402 | 4.901350e-04 | 5 | 2 | {'max_features': 5, 'n_estimators': 2} | 0.690991 | 0.692310 | 0.703432 | 0.692482 | 0.669314 | 0.689706 | 0.011139 | 10 |
Check Important Feature
각각의 Feature별로 Model에서의 중요도는 다 다를 것 이다.
중요도가 낮은 Feature는 오히려 Model의 성능을 낮추고 Complexity만 높이는 결과를 초래할 수 있다.
Sklearn에서는 이러한 변수들의 중요도를 확인할 수 있다.
1
2
3
4
5
6
7
8
9
# Feature Importance
feature_importances = grid_search.best_estimator_.feature_importances_

# Print Feature Importance with Feature name
extra_attribs = ["rooms_per_hhold", "pop_per_hhold", "bedrooms_per_room"]
cat_encoder = cat_pipeline.named_steps["cat_encoder"]
cat_one_hot_attribs = list(cat_encoder.categories_[0])
attributes = num_attribs + extra_attribs + cat_one_hot_attribs
sorted(zip(feature_importances, attributes), reverse=True)
1
2
3
4
5
6
7
8
9
10
11
12
13
14
15
16
[(0.36615898061813423, 'median_income'),
 (0.16478099356159054, 'INLAND'),
 (0.10879295677551575, 'pop_per_hhold'),
 (0.07334423551601243, 'longitude'),
 (0.06290907048262032, 'latitude'),
 (0.056419179181954014, 'rooms_per_hhold'),
 (0.053351077347675815, 'bedrooms_per_room'),
 (0.04114379847872964, 'housing_median_age'),
 (0.014874280890402769, 'population'),
 (0.014672685420543239, 'total_rooms'),
 (0.014257599323407808, 'households'),
 (0.014106483453584104, 'total_bedrooms'),
 (0.010311488326303788, '<1H OCEAN'),
 (0.0028564746373201584, 'NEAR OCEAN'),
 (0.0019604155994780706, 'NEAR BAY'),
 (6.0280386727366e-05, 'ISLAND')]
Test
실제 Testset으로서 결과를 확인하면 다음과 같다.
1
2
3
4
5
6
7
8
9
10
11
12
from sklearn.metrics import r2_score

final_model = grid_search.best_estimator_

X_test = strat_test_set.drop("median_house_value", axis=1)
y_test = strat_test_set["median_house_value"].copy()

X_test_prepared = full_pipeline.transform(X_test)
final_predictions = final_model.predict(X_test_prepared)

final_r2 = r2_score(y_test, final_predictions)
print(final_r2)
1
0.8251813171106782
Confidence Intervel
먼저 r2_score가 아닌 RMSE로서 생각한다면 다음과 같다.
결국에는 RMSE란 \(\text{RMSE} = \sum_{i=1}^{n}sqrt{y_i - \hat{y_i}}\)로서 표현할 수 있다.
이러한 Error는 하나의 값으로서 표현되지만, \(\sqrt{y_i - \hat{y_i}}\)는 여러개의 값으로 Distribution을 이룰수 있다.
이러한 특성 때문에 Confidence Intervel을 구할 수 있게 된다.
아래 구하는 방식은 scipy.stats를 활용하여 Confidencial Intervel을 구하는 방법이다.
- confidence: Confidence
- len(squared_errors) - 1: 자유도 (n-1)
- loc: Mean의 위치
- scale: 분산의 크기 (scipy.stats.sem 참조)
1
2
3
4
5
6
7
from scipy import stats

confidence = 0.95
squared_errors = (final_predictions - y_test) ** 2
print(np.sqrt(stats.t.interval(confidence, len(squared_errors) - 1,
                         loc=squared_errors.mean(),
                         scale=stats.sem(squared_errors))))
1
[45685.10470776 49691.25001878]
위의 결과는 95% 확률로 RMSE가 45685.10470776 ~ 49691.25001878에 위치한다는 뜻이다.
위와 같은 과정은 T분포 혹은 Z Normalization 로서 표현 가능하다.
먼저 Sampling 분포가 다음과 같다고 가정하자.
$$\bar{X} \text{ ~ } N(\mu,\frac{\sigma}{n})$$
위와같은 표본 평균(Sampling Mean)이 존재하게 된다면 각각 다음과 같이 나타낼 수 있다.
$$Z = \frac{\bar{X}-\mu}{\sigma/\sqrt{n}} \text{ ~ } N(0,1)$$
$$T = \frac{\bar{X}-\mu}{S/\sqrt{n}} \text{ ~ } t(n-1)$$
모평균의 구간 추정을 한다고 하면 다음과 같이 나타낼 수 있다.
(모평균 \(\mu\)의 1-\(\alpha\)의 Confidential Intervel, 양측검정)
$$P(-Z_{\alpha/2} \le \frac{\bar{X}-\mu}{\sigma/\sqrt{n}} \le Z_{\alpha/2}) = 1-\alpha \text{ (Z분포)}$$
$$P(-t_{\alpha/2} \le \frac{\bar{X}-\mu}{S/\sqrt{n}} \le t_{\alpha/2}) = 1-\alpha \text{ (T분포}(df=n-1))$$
위의 식을 조금만 정리하면 다음과 같다.
$$P(\mu-Z_{\alpha/2}*\sigma/\sqrt{n} \le \bar{X} \le \mu+Z_{\alpha/2}*\sigma/\sqrt{n}) = 1-\alpha \text{ (Z분포)}$$
$$P(\mu-t_{\alpha/2}*S/\sqrt{n} \le \bar{X} \le \mu+t_{\alpha/2}*S/\sqrt{n}) = 1-\alpha \text{ (T분포}(df=n-1))$$
참조
아래 Code는 Sampling분포와 T-test에 대하여 사전지식이 있어야 하는 Code이다.
위의 설명이 이해되지 않으면 아래 링크를 참조하자.
1
2
3
4
5
6
7
8
9
10
11
print('T-Scores')
m = len(squared_errors)
mean = squared_errors.mean()
tscore = stats.t.ppf((1 + confidence) / 2, df=m - 1)
tmargin = tscore * squared_errors.std(ddof=1) / np.sqrt(m)
print(np.sqrt(mean - tmargin), np.sqrt(mean + tmargin))

print('\nZ-Score')
zscore = stats.norm.ppf((1 + confidence) / 2)
zmargin = zscore * squared_errors.std(ddof=1) / np.sqrt(m)
print(np.sqrt(mean - zmargin), np.sqrt(mean + zmargin))
1
2
3
4
5
T-Scores
45685.10470776014 49691.25001877871

Z-Score
45685.717918136594 49690.68623889426
Experiment 3. 가장 중요한 특성을 선택하는 변환기를 준비 파이프라인에 추가하여라.
먼저 Feature_Improtance(Numpy.ndarray)가 입력으로 들어왔을 때 Index의 Value를 Sorting하고 Index값을 반환받게 설정
1
2
3
4
# Select Sorted Top of k in Array
def indicies_of_top_k(arr,k):
    sorted_arr = np.argsort(feature_importances)
    return sorted(sorted_arr[-k:])
Estimator를 Customizing한다.
fit()에서는 Index를 반환받고, transform()에서는 Data의 해당되는 Index의 자료를 Return한다.
1
2
3
4
5
6
7
8
9
10
# Customize Estimator
class TopFeatureSelector(BaseEstimator, TransformerMixin):
    def __init__(self, feature_importance,k):
        self.feature_importance = feature_importance
        self.k = k
    def fit(self, X, y=None):
        self.indices = indicies_of_top_k(self.feature_importance,self.k)
        return self
    def transform(self, X):
        return X[:,self.indices]
1
2
3
4
5
6
7
8
9
10
k = 5

# Using PipeLine
preparation_and_feature_selection_pipeline = Pipeline([
    ('preparation', full_pipeline),
    ('feature_selection', TopFeatureSelector(feature_importances, k))
])

full_pipeline_features = full_pipeline.fit_transform(housing)
housing_prepared_top_k_features = preparation_and_feature_selection_pipeline.fit_transform(housing)
결과 확인은 하게 되면 16개의 Feature에서 중요한 5개의 Feature만 선택된 것을 확인할 수 있다.
1
2
print('Full PipeLine Feature',full_pipeline_features.shape[1:])
print('Top 5 Feature',housing_prepared_top_k_features.shape[1:])
1
2
Full PipeLine Feature (16,)
Top 5 Feature (5,)
실제 작성한 Method가 잘 작동하나 Step by Step으로 확인하면 다음과 같다.
1
2
3
check_list = list(zip(feature_importances, attributes))
for i,j in enumerate(check_list):
    print('Index: {},  {}'.format(i,j))
1
2
3
4
5
6
7
8
9
10
11
12
13
14
15
16
Index: 0,  (0.07334423551601243, 'longitude')
Index: 1,  (0.06290907048262032, 'latitude')
Index: 2,  (0.04114379847872964, 'housing_median_age')
Index: 3,  (0.014672685420543239, 'total_rooms')
Index: 4,  (0.014106483453584104, 'total_bedrooms')
Index: 5,  (0.014874280890402769, 'population')
Index: 6,  (0.014257599323407808, 'households')
Index: 7,  (0.36615898061813423, 'median_income')
Index: 8,  (0.056419179181954014, 'rooms_per_hhold')
Index: 9,  (0.10879295677551575, 'pop_per_hhold')
Index: 10,  (0.053351077347675815, 'bedrooms_per_room')
Index: 11,  (0.010311488326303788, '<1H OCEAN')
Index: 12,  (0.16478099356159054, 'INLAND')
Index: 13,  (6.0280386727366e-05, 'ISLAND')
Index: 14,  (0.0019604155994780706, 'NEAR BAY')
Index: 15,  (0.0028564746373201584, 'NEAR OCEAN')
1
sorted(zip(feature_importances, attributes), reverse=True)
1
2
3
4
5
6
7
8
9
10
11
12
13
14
15
16
[(0.36615898061813423, 'median_income'),
 (0.16478099356159054, 'INLAND'),
 (0.10879295677551575, 'pop_per_hhold'),
 (0.07334423551601243, 'longitude'),
 (0.06290907048262032, 'latitude'),
 (0.056419179181954014, 'rooms_per_hhold'),
 (0.053351077347675815, 'bedrooms_per_room'),
 (0.04114379847872964, 'housing_median_age'),
 (0.014874280890402769, 'population'),
 (0.014672685420543239, 'total_rooms'),
 (0.014257599323407808, 'households'),
 (0.014106483453584104, 'total_bedrooms'),
 (0.010311488326303788, '<1H OCEAN'),
 (0.0028564746373201584, 'NEAR OCEAN'),
 (0.0019604155994780706, 'NEAR BAY'),
 (6.0280386727366e-05, 'ISLAND')]
1
2
indicies = indicies_of_top_k(feature_importances,5)
print(indicies)
1
[0, 1, 7, 9, 12]
1
full_pipeline_features[:1]
1
2
3
4
array([[-1.15604281,  0.77194962,  0.74333089, -0.49323393, -0.44543821,
        -0.63621141, -0.42069842, -0.61493744, -0.31205452, -0.08649871,
         0.15531753,  1.        ,  0.        ,  0.        ,  0.        ,
         0.        ]])
1
full_pipeline_features[:1,indicies]
1
array([[-1.15604281,  0.77194962, -0.61493744, -0.08649871,  0.        ]])
1
housing_prepared_top_k_features[:1]
1
array([[-1.15604281,  0.77194962, -0.61493744, -0.08649871,  0.        ]])
참조: 원본코드
코드에 문제가 있거나 궁금한 점이 있으면 wjddyd66@naver.com으로 Mail을 남겨주세요.

Leave a comment